A lot of headline numbers show an economy that’s in pretty good shape. Official unemployment is 5%. GDP is growing at a totally acceptable 3% rate. Stocks are at all-time highs. Bonds, from US Treasuries to corporate junk, are priced as richly as they’ve ever been. These are all signs of robust health.
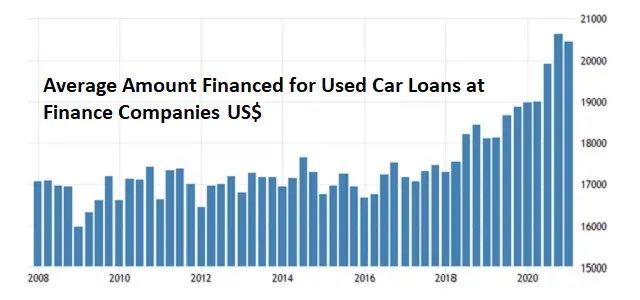
Until you remember that the cost of achieving this kind of statistical nirvana keeps rising. Just a couple of many possible examples: With messed up supply chains producing a shortage of new cars, used car prices are soaring, which forces buyers to finance amounts that can’t help but strain family budgets. Remember, this is for used cars:
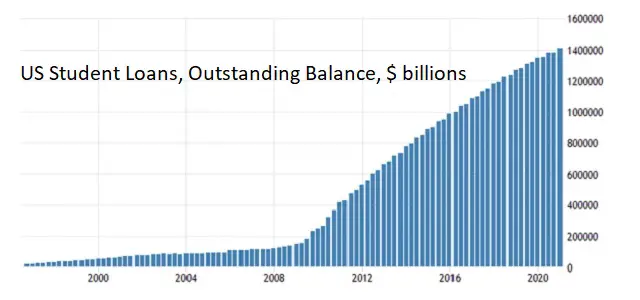
Students, meanwhile, are still borrowing crazy amounts of money for questionable degrees, but in an era of campus lockdowns and “distance learning,” the education they’re borrowing to buy is even more questionable than before.
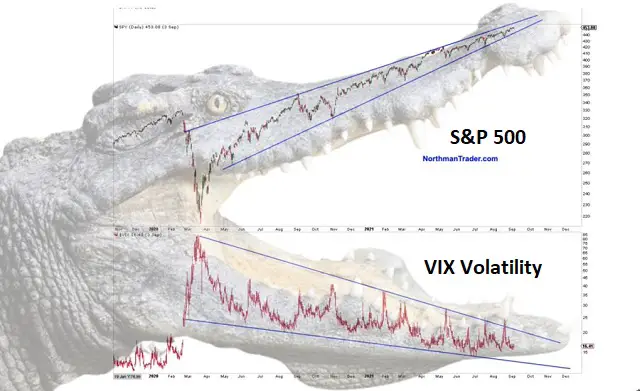
As for stock prices and market action, this evocative chart from Northman Trader illustrates the kind of set-up that, in pre-QE days, would have had short-sellers salivating. Now it’s a set-up for governments buying equities to keep the rally going.
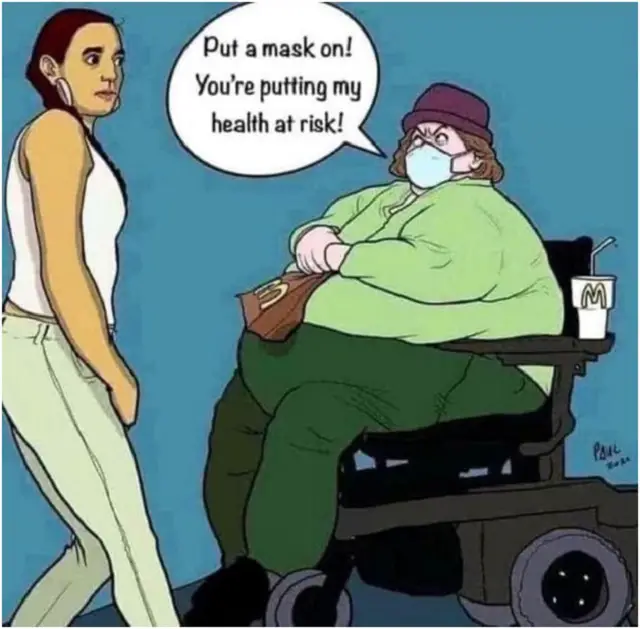
Another part of life where the headlines seem out of step with reality is the current pandemic debate. The US, along with much of the rest of the world (see Australia’s descent into quasi fascism) is apparently drifting back into a crazy quilt of mask mandates and vaccine passports that will make it hard for most small businesses to survive.
But the pandemic’s actual damage doesn’t seem to match the draconian response.
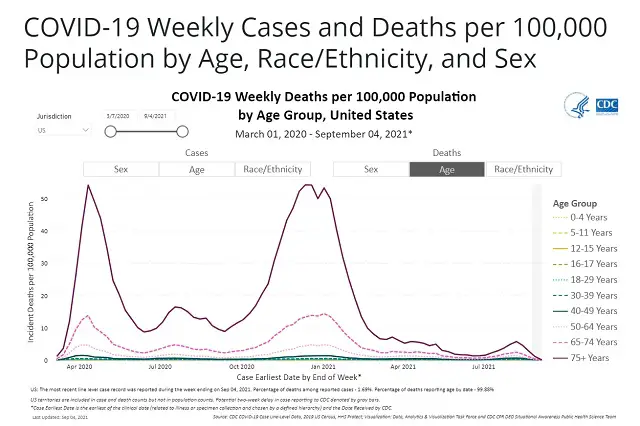
The CDC, for instance publishes a “Covid death tracker” chart showing deaths by age group (per 100,000 people). Since the January peak (which was only a “peak” for the very old and/or already sick), deaths for all age groups have plummeted to the point that the only visible lines are for those over 65. In other words it’s serious for specific groups but hardly a national crisis.
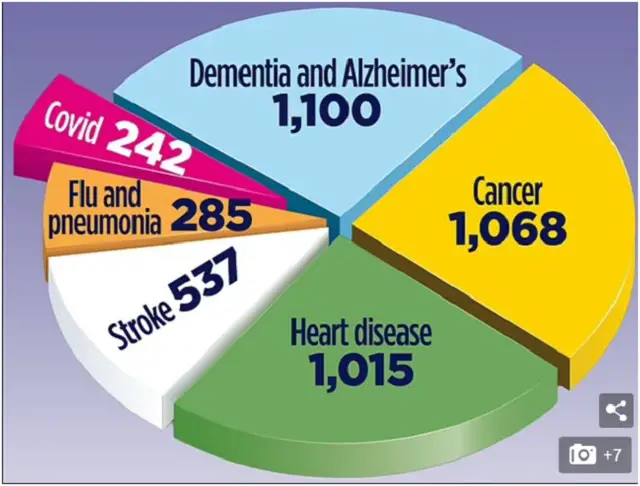
People are still dying, of course. But of lots of things besides covid. The next chart is for the UK, where “flu and pneumonia” are claiming more casualties than covid.
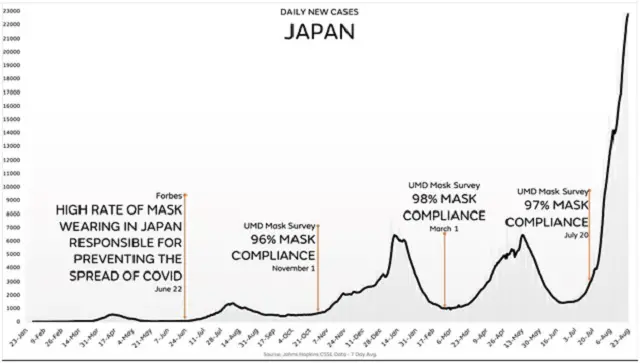
Still, masks and all the rest do help, right? Well, here’s Japan, a zealous mask-mandater with 97% compliance. One might conclude from this chart that masks make things worse.
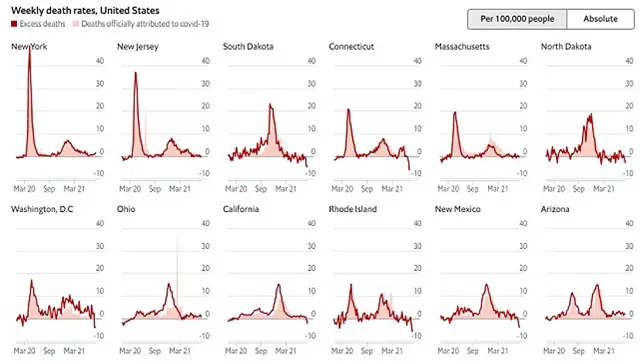
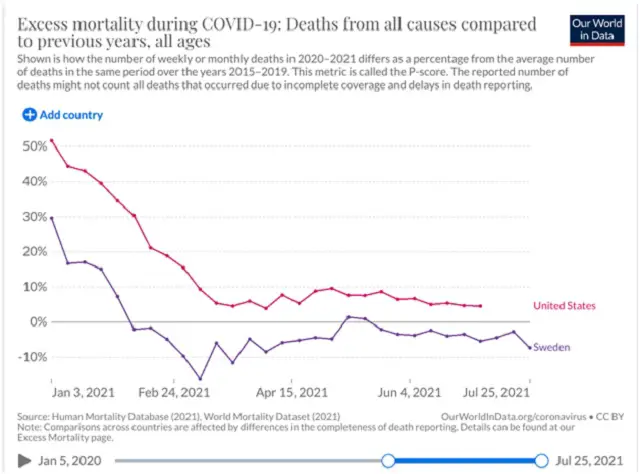
Another way of measuring the power of a pandemic is “excess deaths,” that is, deaths that wouldn’t normally be expected to happen based on previous trends. Here’s a partial list (the rest are here) showing that in most US states excess deaths are at zero and in some cases negative, meaning that fewer people are dying than normally expected for this time of year. Again, an apparent non-event.
Now, one could argue that this is a portrait of success, as the extreme measures the US took in response to the initial outbreak are bearing fruit. Except that Sweden, which pretty much ignored the pandemic, is doing even better, with consistently negative excess mortality.
The political impact of headlines that seem at odds with lived experience is pretty brutal, as the two worldviews (“we’re on the right track, we just need more debt and stricter rules” vs “what the hell are you people doing???”) separate us into tribes that each suspect the other of running some kind of con.
Lockdown maximalists should note that a big part of the country now views them with this kind of bemusement.