Already troubled asset classes, such as student housing and student housing CMBS, face turmoil.
By Wolf Richter for WOLF STREET.
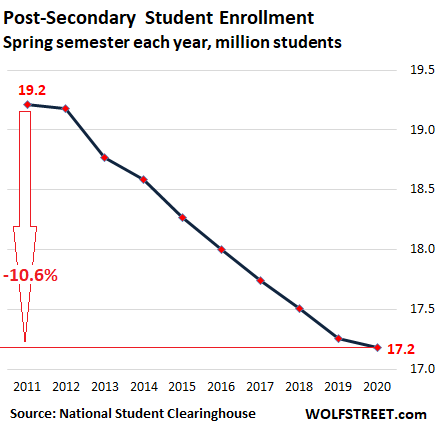
The pandemic threw higher education into chaos in the middle of the spring semester. How this will pan out for students, colleges, the whole army of people that works in higher education, the asset class of student housing, student housing mortgages packaged into commercial mortgage backed securities (CMBS), text-book publishers, and the rest of the industries surrounding the sector is highly uncertain. But even before the crisis hit, before the shutdowns, student enrollment in the spring 2020 fell for the ninth year in a row.
The number of post-secondary students – undergraduate and graduate students – fell 0.5% from the Spring semester last year, or by over 83,800 students to 17.18 million students, according to the Current Term Enrollment Estimates Report by the National Student Clearinghouse Research Center, released on Tuesday. Compared to the spring semester in 2011, enrollment is now down by 10.6%, or by 2.03 million students:
The Clearinghouse emphasized that based on the cutoff date for the submission of the data, “the current report should be viewed as a pre-shutdown, start-of-term baseline that does not reflect any effects of the pandemic on enrollments.”
The report is based on enrollment data submitted to the Clearinghouse by educational institutions (not survey based) and covers 97% of total enrollment of degree-granting institutions in the US. Since the data is submitted at the student level, it is apparent when students are enrolled in more than one institution, and those duplications are removed from the data, to generate the “unduplicated student headcount” in the chart above. International students, accounting for close to 5% of total enrollment, have been excluded from the student headcount.
All types of colleges were hit by enrollment declines.
This spring semester, compared to spring 2019, enrollment declined in all institution sectors. The largest percentage drop was at public two-year colleges:
- Public two-year: -2.3%
- Private for-profit four-year: -1.9%
- Private nonprofit four-year: -0.7%
- Public four-year: -0.6%
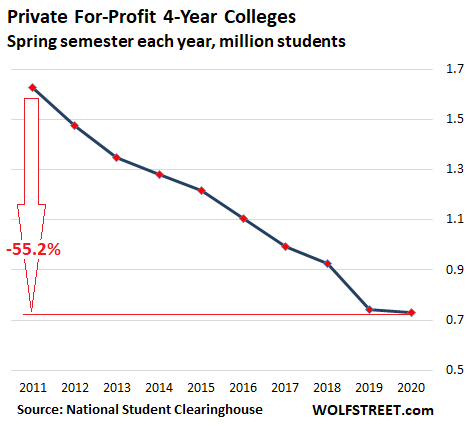
Enrollment in private for-profit colleges has collapsed since 2011.
After a long series of scandals, the government’s response to those scandals, and innumerable lawsuits filed by shafted students and others, enrollment in private for-profit four-year colleges has plunged by 55.2% in nine years, from 1.63 million students in the spring semester of 2011 to 729,364 students this spring semester – accounting for 44% of the drop in total enrollment in all types of institutions since 2011:
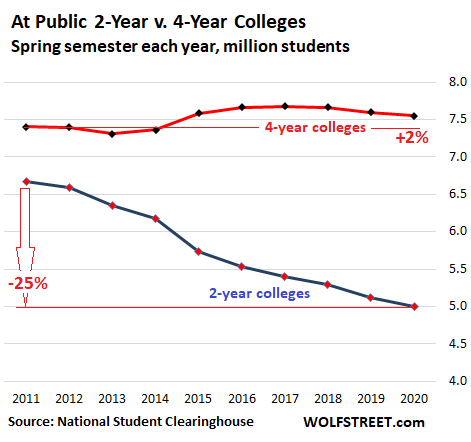
Enrollment in public schools has diverged.
At public two-year schools, the 2.3% drop in enrollment this year added to the drop in prior years; and since the spring semester of 2011, enrollment has plunged by 25%, or by 1.67 million students, pushing the total down to 4.997 million students (blue line in the chart below).
At public four-year schools, enrollment had seen increases in 2015 through 2017 (7.68 million students), as some of the students that were abandoning for-profit colleges decided to continue with their education at public schools. But then enrollment began to decline again, dropping 1.7% since 2017, to 7.55 million students. It remains 2% higher than it had been in 2011 (red line in the chart below):
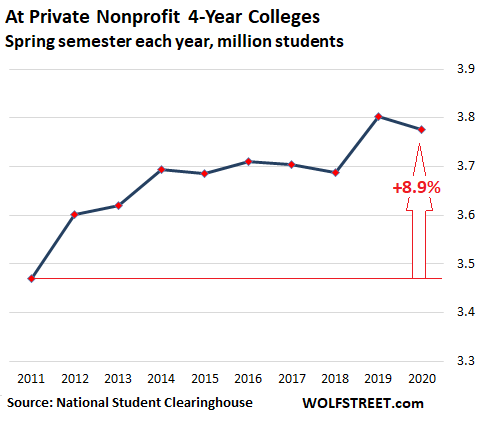
Enrollment in private non-profit colleges falls, after surge last year.
Back in the spring of 2019, enrollment at private nonprofit four-year colleges – this includes some of the most elite universities in the US – had jumped 3%, the largest percentage increase since 2012, after years of stagnating or declining. But this spring, enrollment declined 0.7% to 3.78 million students. Nevertheless, since 2011, these institutions have gained 8.9% in enrollment:
Majors.
Of all students with declared majors (9.06 million), the top two majors combined – “Business, Management, Marketing, and Related Support” and “Health Professions and Related Clinical Sciences” – accounted for 28.5%. Over the two years since 2018, however, those majors declined by 3.0% and 2.1% respectively.
The third largest major – “Liberal Arts and Sciences, General Studies and Humanities” – dropped by nearly 12% in those two years.
Enrollment in “Computer and Information Sciences and Support Services,” the sixth largest major, jumped by 10.4%.
The table below shows the broad categories of majors, how many students declared them their major in the spring semester 2020, and the percentage change from two years ago.
The STEM majors (science, technology, engineering, mathematics) are spread over a number of majors in the list below (here’s UC’s 32-page list and descriptions of STEM fields, ranging from “Agricultural Animal Breeding” and “Aeronautical/Aerospace Engineering” to “Petroleum Technology” and “Systems Engineering”). If your smartphone clips the third column, hold the device in landscape position.
| Major | Spring 2020 Enrollment | % v. 2018 |
| Business, Management, Marketing, and Related Support | 1,527,889 | -3.0% |
| Health Professions and Related Clinical Sciences | 1,052,148 | -2.1% |
| Liberal Arts and Sciences, General Studies and Humanities | 932,596 | -11.9% |
| Biological and Biomedical Sciences | 575,084 | -0.7% |
| Engineering | 550,966 | -3.0% |
| Computer and Information Sciences and Support Services | 467,204 | 10.4% |
| Psychology | 457,506 | 5.5% |
| Education | 438,195 | -2.6% |
| Social Sciences | 422,438 | -3.4% |
| Visual and Performing Arts | 387,897 | 1.5% |
| Communication, Journalism, and Related Programs | 309,306 | -4.4% |
| Security and Protective Services | 272,986 | -1.8% |
| Multi/Interdisciplinary Studies | 228,253 | -0.4% |
| Parks, Recreation, Leisure and Fitness Studies | 221,086 | -3.4% |
| Public Administration and Social Service Professions | 132,563 | -4.7% |
| Physical Sciences | 128,317 | -9.1% |
| English Language and Literature/Letters | 126,902 | -9.6% |
| Engineering Technologies/Technicians | 98,402 | -4.0% |
| Family and Consumer Sciences/Human Sciences | 88,081 | -8.7% |
| Mathematics and Statistics | 87,493 | -2.4% |
| Agriculture, Agriculture Operations, and Related Sciences | 84,886 | -3.1% |
| History | 81,024 | -4.1% |
| Natural Resources and Conservation | 80,801 | 3.0% |
| Foreign Languages, Literatures, and Linguistics | 53,644 | -7.7% |
| Architecture and Related Services | 42,624 | 7.4% |
| Philosophy and Religious Studies | 31,713 | -8.1% |
| Transportation and Materials Moving | 30,887 | 12.1% |
| Theology and Religious Vocations | 25,494 | -11.3% |
| Area, Ethnic, Cultural, and Gender Studies | 25,735 | -1.1% |
| Legal Professions and Studies | 23,166 | -2.6% |
| Communications Technologies/Technicians and Support Services | 20,440 | 8.5% |
| Personal and Culinary Services | 14,066 | -19.7% |
| Mechanic and Repair Technologies/Technicians | 13,967 | -9.3% |
| Construction Trades | 10,170 | -1.5% |
| Science Technologies/Technicians | 7,886 | 0.9% |
| Precision Production | 5,678 | 0.1% |
Undergraduate v. Graduate Students and Age.
Of the total student enrollment in the spring semester, 15.6% were graduate students. Their number, 2.73 million, was roughly stable with a year ago, after two years of increases.
The age of all students as a percent of total enrollment:
- Under 18: 4.1%
- Between 18 and 24: 60.2%
- Over 24 years old: 35.6%
Average age of undergraduate students:
- Full-time: 22.7 years
- Part-time: 27.7 years.
Average age of graduate students:
- Full-time: 30.5 years
- Part-time: 35.4 years.
Men are leaving the classroom.
Men accounted for just 41.4%, or 7.2 million students, of total student headcount in the spring semester. The enrollment of men has continued to decline every year since 2011, including by 1.8% this spring semester, by 2.8% a year ago, and by 1.9% two years ago.
Women accounted for 58.6%, or 10.2 million students, of the student headcount in the spring semester. This spring, enrollment ticked up 0.5% after having declined by 0.8% in each of the prior two years.
Now what?
Even before the pandemic and the lockdowns, these were very tough dynamics for this huge sector of higher education that drives so much and engendered entire industries, such as text-book publishers, and asset classes such as “student housing” and student-housing CMBS, whose delinquency rates began spiking last year.
While a few colleges have been able to grow their enrollments in recent years, others have experienced declining enrollment. The huge expense of higher education in the US surely acts as a ceiling for many potential students. And a hot job market, as it was before Covid, gave many potential students appealing alternatives.
Now all this is history. Enrollment going forward is in turmoil. There are voices now recommending that students consider taking a year off and go do something else, until the dust settles. Some schools are switching at least temporarily some or all of their coursework to online, and students can live anywhere to take those courses. There are other big changes now underway.
And many local economies centered around universities will experience considerable upheaval, including in their real estate market and its creditors and investors, as these students suddenly don’t show up, or don’t show up in the usual numbers – that in many places have already been declining for years.