by Jesse
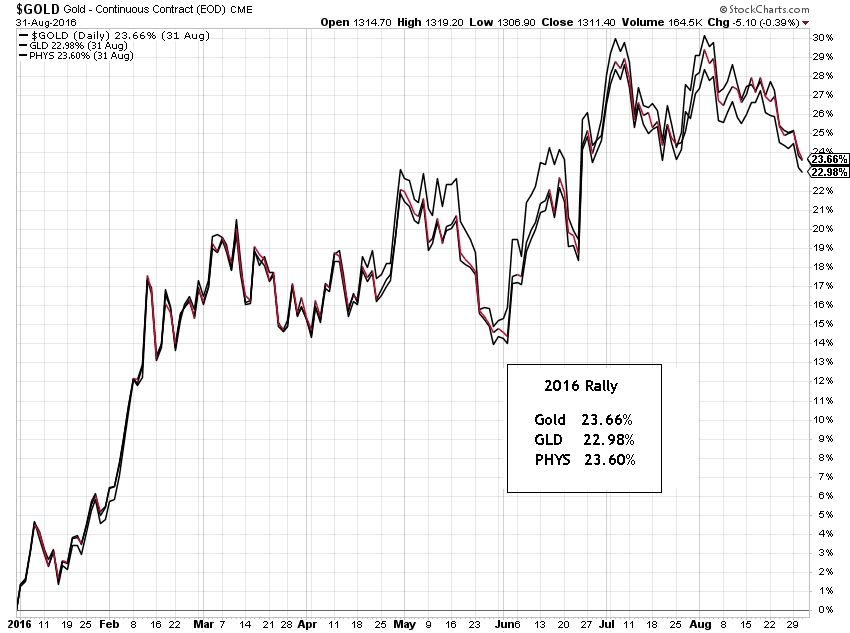
Comparing GLD and PHYS, we see that their performance is fairly close to the performance of gold itself.
In the decline of this year there is more ‘slippage’ in PHYS as compared to GLD, by about 100 bp.
But in the gold rally of 2016, PHYS outperformed GLD by almost 60 bp.
If we run a comparison over a two year period to date, which includes a decline – rally – decline the price of gold, we see the spread between PHYS and GLD widen to a more substantial 228 bp.
And that is an even more substantial slippage of 334 bp compared to the price of gold itself.
There is a ‘premium’ in PHYS as compared to Gold and GLD that expands and contracts depending on the bullish temperament of the market.
I have included two more charts back from 2010 that shows this.
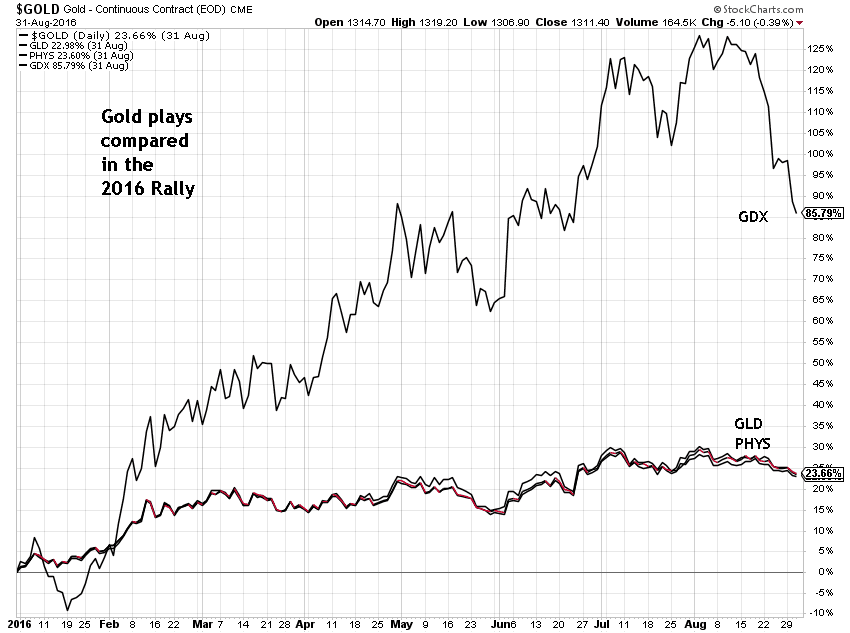
And then there are the miners. I have included two charts with the large cap gold miners GDX below.
Just a quick glance at those charts clearly shows the leverage, or beta with regard to the underlying asset which is gold, in the miners.
The gains are significantly greater, but the declines are also much larger.
I am merely providing the data here for you to consider. If you don’t know what to do with it, then it probably is something you ought not to worry about.
There are other things to consider of course, including security, fees, storage, the purpose of the asset in your portfolio, and the time horizon for which you are holding it.