Data source: WHO Situation reports
Curve estimates using R (Link to free download) with prediction intervals using the propagate package. Code below (quick note – propogate function not necessary for this figure, but generates 95% prediction intervals [only means are shown on graph], but prediction intervals will be displayed if you run code):
library(propagate)
par(family="serif")
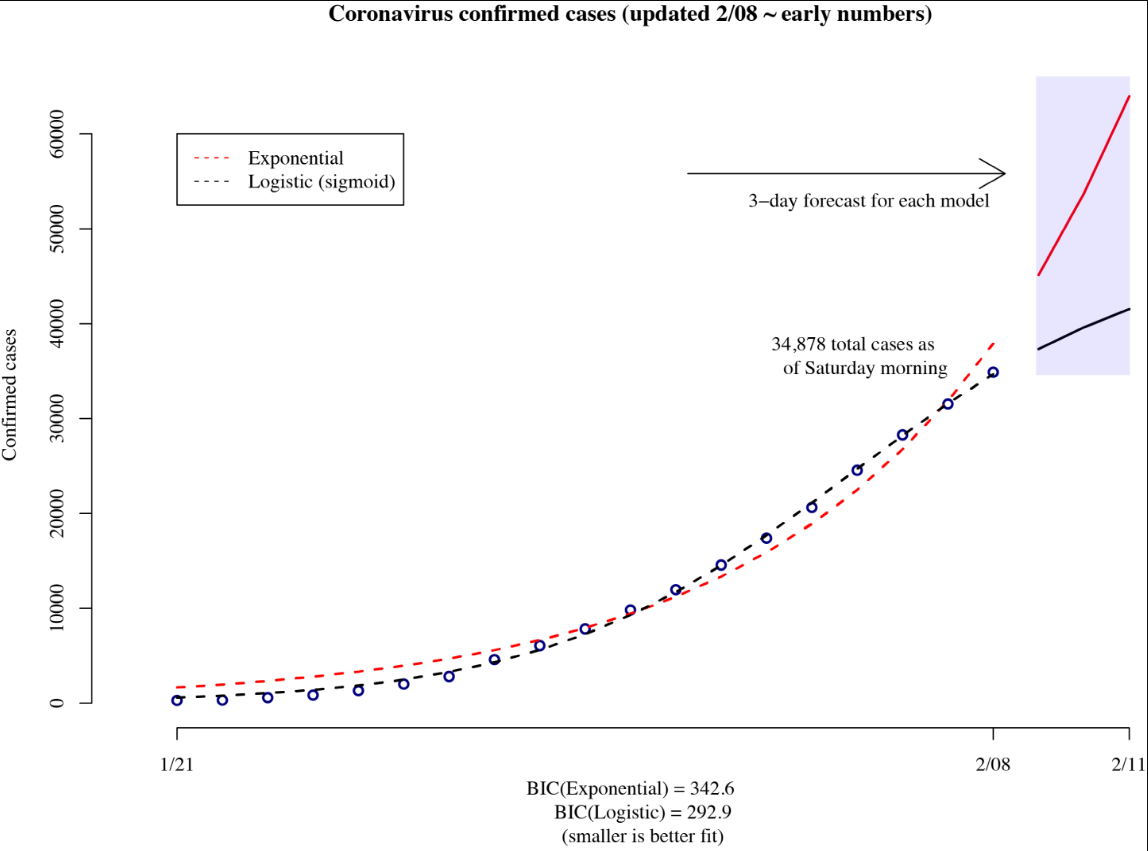
Y <- c(282, 314, 581, 846, 1320, 2014, 2798, 4593, 6065, 7818, 9826,
11953, 14557, 17391, 20630, 24554, 28276, 31532, 34878)
n <- as.numeric(length(Y))
temp <- data.frame(y = Y, x = seq(1:n))
# Exponential and Logistic (sigmoid) functions
mod <- nls(y ~ exp(a + b * x), data = temp, start = list(a = 0, b = 1))
Z <- nls(y ~ SSlogis(x, Asym, xmid, scal), temp)
BIC(mod, Z)
(PROP1 <- predictNLS(mod, newdata = data.frame(x = c(n+1, n+2, n+3)), interval = "prediction"))
(PROP2 <- predictNLS(Z, newdata = data.frame(x = c(n+1, n+2, n+3)), interval = "prediction"))
az<-as.data.frame(rbind(PROP2$prop[[1]]$sim[1],
PROP2$prop[[2]]$sim[1],
PROP2$prop[[3]]$sim[1]))
bz<-as.data.frame(rbind(PROP1$prop[[1]]$sim[1],
PROP1$prop[[2]]$sim[1],
PROP1$prop[[3]]$sim[1]))
plot(temp$x, temp$y, ylab = "Confirmed cases", xlab="", xlim=c(0,n+3),
ylim=c(0,65000),
col="navy", lwd=2, axes=F,
main = "Coronavirus confirmed cases (updated 2/08 ~ early numbers)",
sub = "BIC(Exponential) = 342.6
BIC(Logistic) = 292.9
(smaller is better fit)")
axis(2)
axis(1, at=c(1, n, n+3), lab=c("1/21", "2/08", "2/11"))
lines(seq(1:n), predict(mod, list(x = seq(1:n))), lty=2, lwd=2, col='red')
lines(seq(1:n), predict(Z, list(x = seq(1:n))), lty=2, lwd=2)
text(14, 32000, "34,878 total cases as
of Saturday morning")
lines(c(n+1, n+2, n+3),az$Mean, col="black", lwd=2)
lines(c(n+1, n+2, n+3),bz$Mean, col="red", lwd=2)
arrows(11, 50000, 18,50000)
text(15, 47000, "3-day forecast for each model")
legend(1, 60000, legend=c("Exponential", "Logistic (sigmoid)"),
col=c("red", "black"), lty=2)