The statistical crash probability analysis (SCPA) algorithm’s forecast for an interim market bottom to occur on March 23, 2020, was precisely accurate. It was the algo’s third consecutive precise major global markets call for March of 2020.
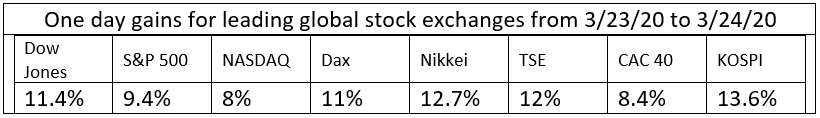
The day after the “Probability is 87% that market is at interim bottom” article was published on March 23, 2020, the Dow Jones Industrials composite index rallied by 11.4%, its biggest one day percentage increase since 1933. Additionally, Canada’s TSE index set an all-time record with a gain of 12.7%. Below are the gains for all of the global stock indices in the article.

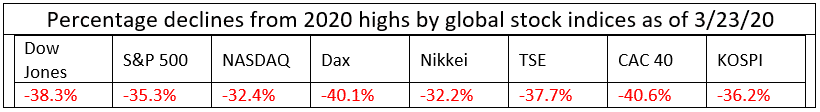
According to the SCPA in the articles below the indices were forecasted to decline by 34% from their 2020 highs by March 21, 2020.
- “US Stock Market to decline by another 22% by Easter”, March 6, 2020
- “2020 Crash is third ‘Category 5 Hurricane’ in 90 years! Get out of market today!”, March 9, 2020
As of March 23, 2020, six of the indices had declined by more than 34%!
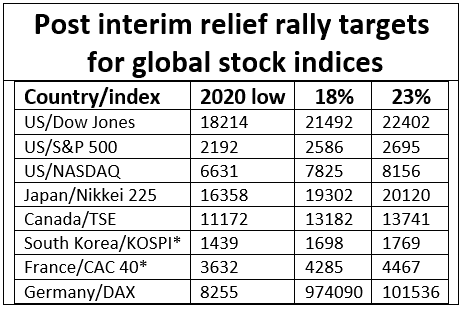
The SCPA now says that the probability is 100% that the indices will rally by 18% off of the lows. The probability is 50% that the indices could increase by 23% from their lows.
Everyone should take advantage of the Bear market rally that is currently underway to GET OUT OF THE MARKET! The bear that has arrived could potentially be more vicious than the 1929 bear.
SCPA’s April forecasts:
- 100%- relief rally will peak by April 8, 2020
- 100%- 2020 low will be breached by April 30, 2020
SCPA’s long term forecast is for all eight of the global indices to bottom between September and November of 2022. At the bottom the minimum decline will be 79% below the 2020 highs.
Since the indices have all rallied to within 30% of their 2020 highs, buy and hold investors and advisors should give serious consideration to take advantage of any rallies to liquidate holdings. The Bull & Bear Tracker, which is a trend trading algorithm, could be utilized to quickly recoup losses of 30% for investments that are liquidated and also any capital gains taxes that might be owed.
The Bull & Bear Tracker’s average gain has been above 5% per month since July of 2019. Since its first signal was published on April 9, 2018, and through the end of February 2020, the gain was 77.3% vs. 14.9% for the S&P 500. The Bull & Bear Tracker is projecting double digit gains for March 2020 while the S&P 500 will most likely have double digit losses. For more about the Bull & Bear Tracker’s performance go to https://bullbeartracker.com/news/.
An investor can only allocate capital to be traded by the Bull & Bear Tracker though an approved registered investment advisor. The investment advisor could also be utilized for an investor to get the maximum proceeds from liquidating their investments.
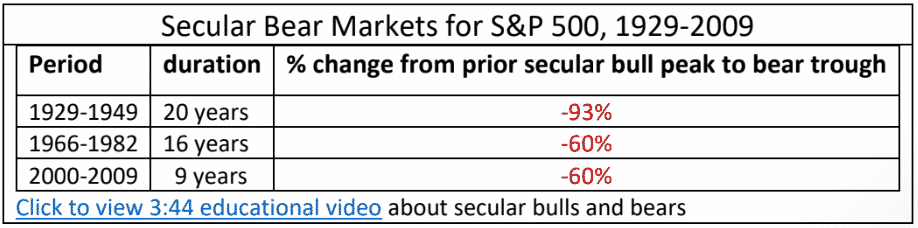
My prediction is that the S&P 500’s secular bull market which began in March 2009 ended on February 19, 2020. The ninth secular bear since 1802, began on February 20, 2020. Based on the peaks of the last three secular bull markets as compared to the troughs of the of the three most recent secular bears, the S&P 500 could decline by an additional 47% to 80% from its March 6, 2020 close.
The video of my “Secular Bulls & Bears: Each requires different investing strategies” workshop at the February 2020 Orlando Money Show is highly recommended. The educational video explains secular bulls and bears and includes strategies to protect assets during secular bear markets and recessions, etc.
BullsNBears.com which covers all of the emerging and declining economic and market trends is an excellent resource site. Click here to view one-minute video about the site.

The 2:50 video below is about my track record for predicting bankruptcies, market crashes and rallies off of crash-bottoms.
