Could the 2007 financial crisis highs and the 2009 lows impact prices 15-years later? We will see!
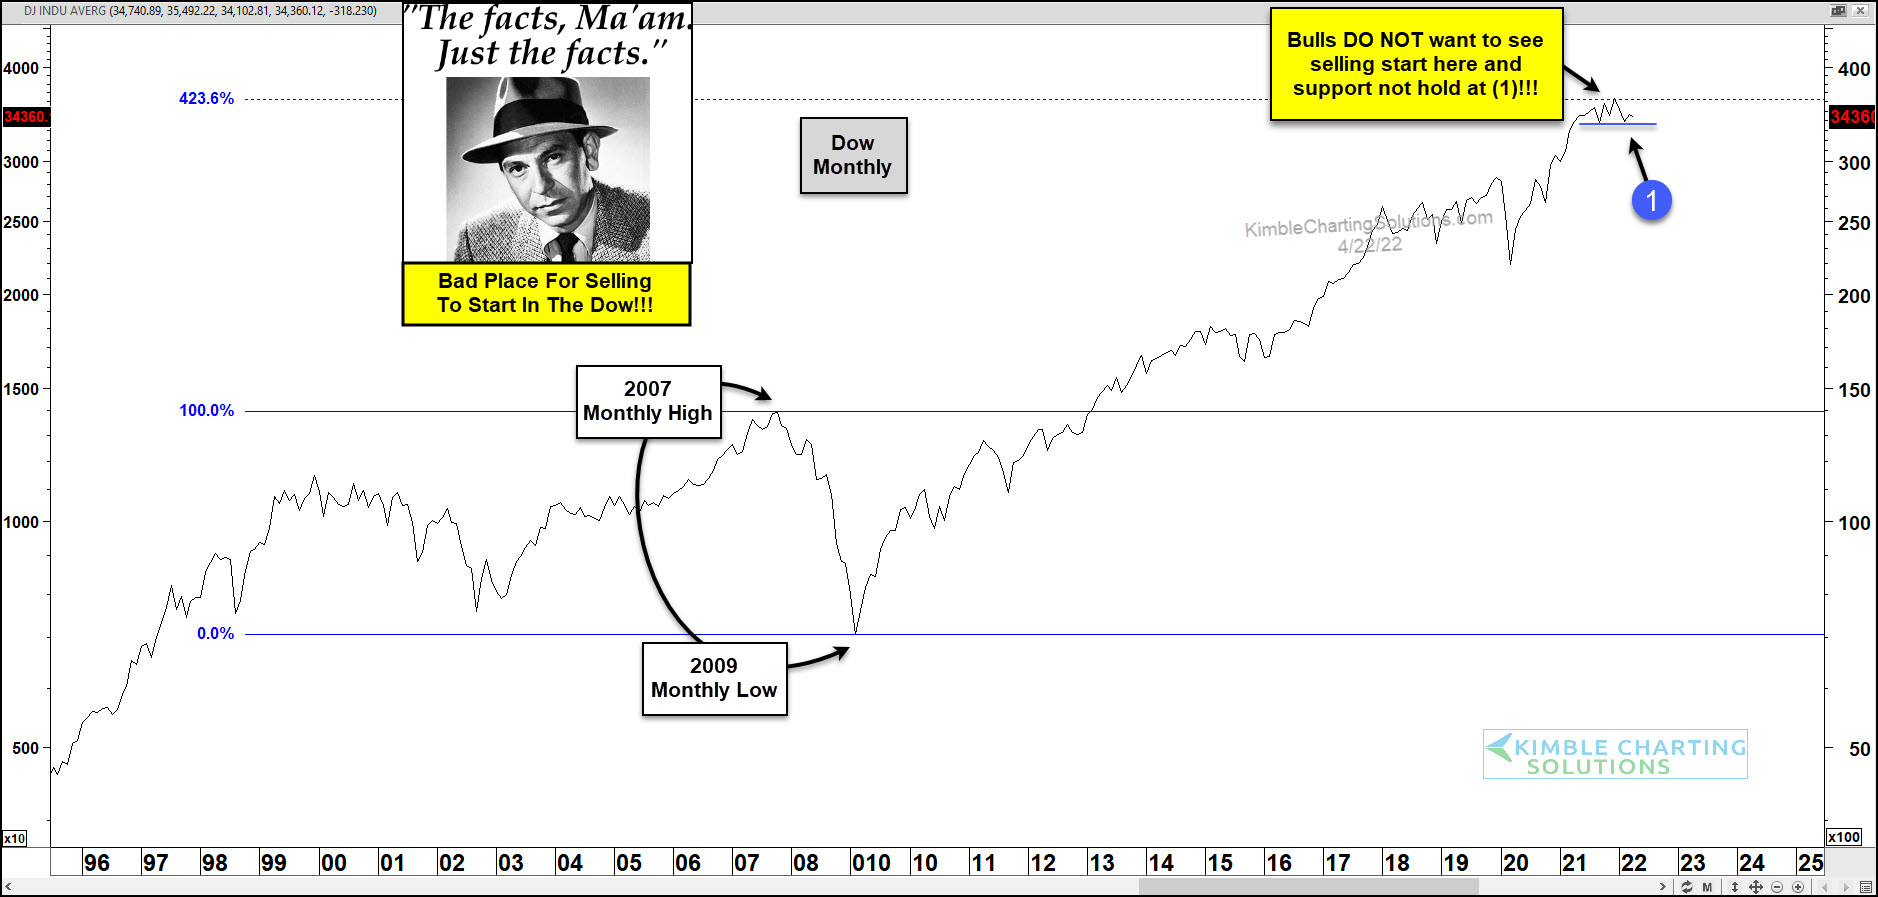
This chart looks at the Dow Jones Industrials on a monthly closing basis. We applied Fibonacci to the 2007 highs and the 2009 lows. The 423% Fibonacci extension level looks to be influencing the Dow over the past 6-months.
Joe Friday Just The Facts Ma’am- If Dow closes out the month below the 33,000, odds increase that the Dow will experience more selling. What the Dow does at support, looks to be very important to bulls and bears!!!
Help Support Independent Media, Please Donate or Subscribe:
Trending:
- CRISIS IN SRI LANKA, No Gas, No Food, Country is Bankrupt, Politicians Being Beat, Murdered, Gov Buildings on Fire, Over 3000 killed in last 24 hours
- Here We Go Again: Monkey Pox!
- Over a Million Italians Over 50 Fined for Refusing Deadly Vax
- The Biggest Economic Danger Right Now? It’s Not the Stock Bubble or Inflation
- FOX NEWS finally showing the world what’s actually happening
- LeBron’s Son Takes a Pretty White Girl to Prom – All the Black Girls Have a Twitter Melton Down
- New York Post: Front Page: “Joe’s Train Wreck”
- NIH THROWS FAUCI UNDER THE BUS BIG TIME!! HE’S FINISHED THE KNIVES ARE OUT
- How Has Monkeypox Spread All Over The Globe At Lightning Speed?
- Malnourished babies are being admitted to HOSPITALS across US
Views: 118