Authored by Lance Roberts via RealInvestmentAdvice.com,
With the third quarter of 2019 reporting season mostly behind us, we can take a look at what happened with earnings to see what’s real, what’s not, and what it will mean for the markets going forward.
The Good
As always is the case, the majority of companies beat their quarterly estimates, as noted by Bespoke Investment Group.
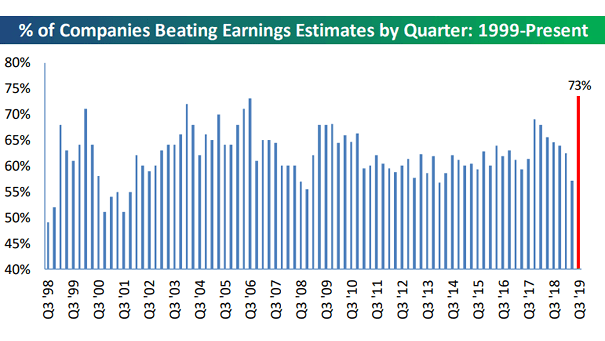
With 73% of companies beating estimates, it certainly suggests that companies in the S&P 500 are firing on all cylinders, which should support higher asset prices.
However, as they say, the “Devil is in the details.”
The Bad
One of the reasons given for the push to new highs was the ‘better than expected’ earnings reports coming in. As noted by FactSet:
“73% have reported actual EPS above the mean EPS estimate…The percentage of companies reporting EPS above the mean EPS estimate is above the 1-year (76%) average and above the 5-year (72%) average.”
The problem is the ‘beat rate’ was simply due to the consistent ‘lowering of the bar’ as shown in the chart below:

Beginning in mid-October last year, estimates for both 2019 and 2020 crashed.
This is why I call it ‘Millennial Soccer.’
Earnings season is now a ‘game’ where scores aren’t kept, the media cheers, and everyone gets a ‘participation trophy’ just for showing up.
Let’s take a look at what really happened with earnings.
During Q3-2019, quarterly operating earnings declined from $40.14 to $40.05 or -0.25%. While operating earnings are completely useless for analysis, as they exclude all the “bad stuff” and mostly fudge the rest, reported earnings declined by from $34.93 to $34.33 or -1.75%.
While those seem like very small declines in actual numbers, context becomes very important. In Q3-2018, quarterly operating earnings were $41.38 and reported earnings were $36.36. In other words, over the last year operating earnings have declined by -3.21% and reported earnings fell by -5.58%. At the same time the S&P 500 index has advanced by 7.08%.
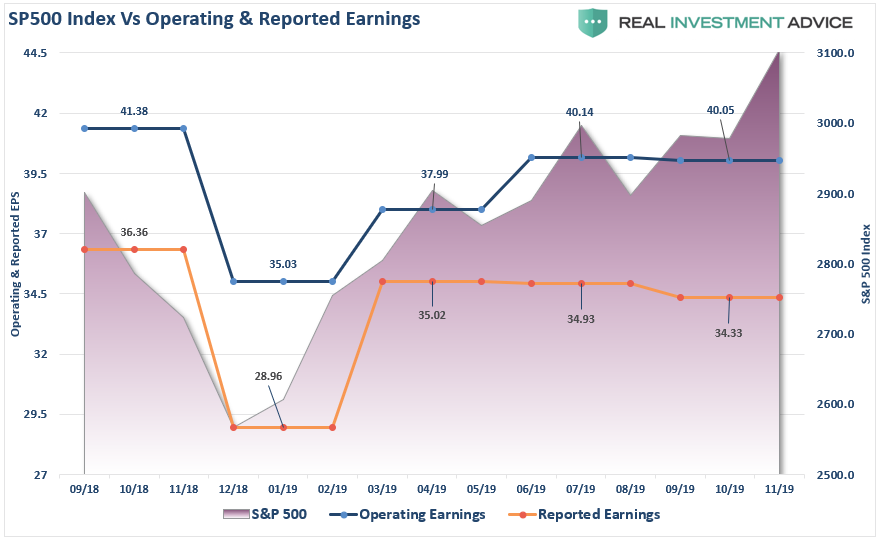
It’s actually worse.
Despite the rise in the S&P 500 index, both Operating and Reported earnings have fallen despite the effect of substantially lower tax rates and massive corporate share repurchases, which reduce the denominator of the EPS calculation.
Steve Goldstein recently penned for MarketWatch
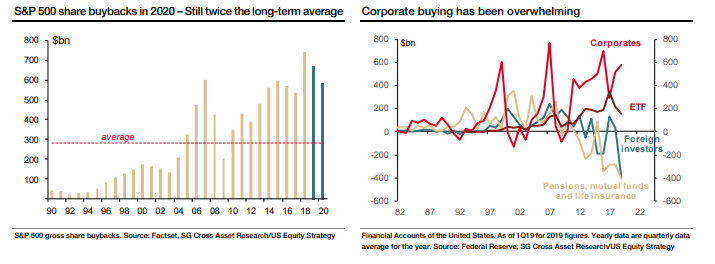
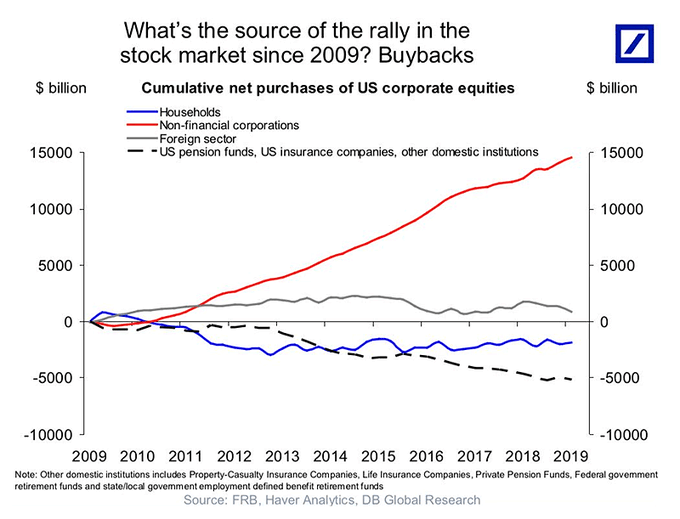
“Research published by the French bank Societe Generale shows that S&P 500 companies have bought back the equivalent of 22% of the index’s market capitalization since 2010, with more than 80% of the companies having a program in place.
The low cost of debt is one reason for the surge, with interest rates not that far above zero, and President Trump’s package of tax cuts in 2017 further triggered a big repatriation of cash held abroad. Since the passage of the Tax Cuts and Jobs Act, non-financial U.S. companies have reduced their foreign earnings held abroad by $601 billion.
This repatriation may have run its course, and stock buybacks should decline from here, but they will still be substantial.”
This is no small thing.
As noted in “4-Risks To The Bullish View,” previously, share repurchases have made up roughly 100% of the net purchases of stocks over the last year.
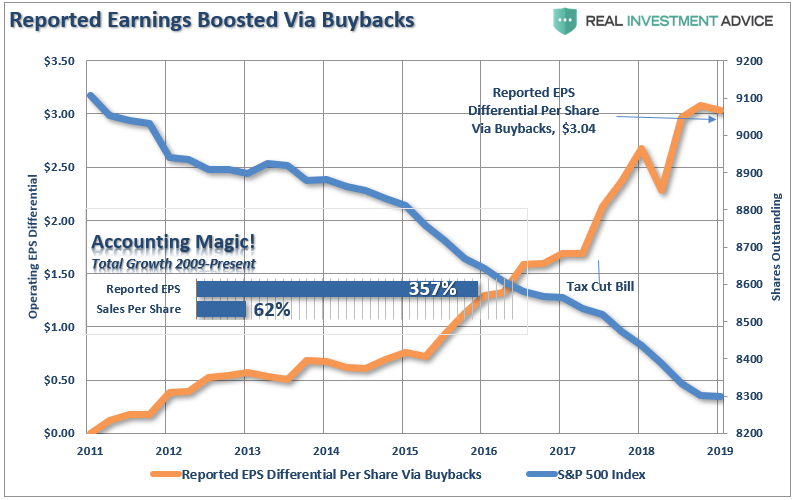
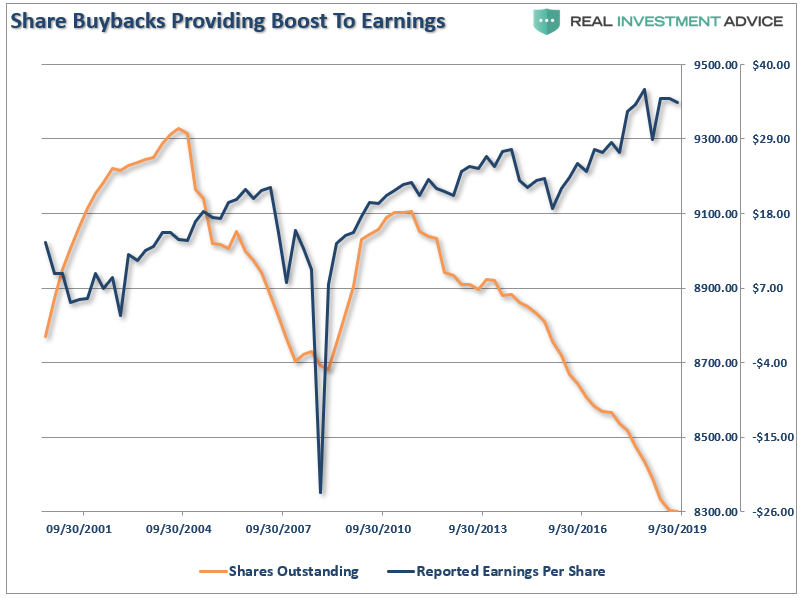
We have discussed the issue of “share buybacks” numerous times and the distortion caused by the use of corporate cash to lower shares outstanding to increase earnings per share.
“The reason companies spend billions on buybacks is to increase bottom-line earnings per share, which provides the ‘illusion’ of increasing profitability to support higher share prices. Since revenue growth has remained extremely weak since the financial crisis, companies have become dependent on inflating earnings on a ‘per share’ basis by reducing the denominator. As the chart below shows, while earnings per share have risen by over 360% since the beginning of 2009; revenue growth has barely eclipsed 50%.”
Chart updated through Q3-2019
The problem with this, of course, is that stock buybacks create an illusion of profitability. However, for investors, the real issue is that almost 100% of the net purchases of equities has come from corporations.
The issue is two-fold:
- That corporate spending binge is slowing down, as noted by Mr. Goldstein; and,
- If a recession sets in, share repurchases could easily cease altogether.
If you don’t think that’s important, the charts above and below should at least make you reconsider.
Of course, such should not be a surprise.
Since the recessionary lows, much of the rise in “profitability” have come from a variety of cost-cutting measures and accounting gimmicks rather than actual increases in top-line revenue. While tax cuts certainly provided the capital for a surge in buybacks, revenue growth, which is directly connected to a consumption-based economy, has remained muted.
Since 2009, the operating earnings per share of corporations has risen 296%. However, the increase in earnings did not come from a commensurate increase in actual revenue which has only grown by a marginal 62% during the same period. At the same time, investors have bid up the market more than 300% from the financial crisis lows of 666.

Needless to say, investors are once again extremely optimistic they haven’t overpaid for assets once again.
Always Optimistic
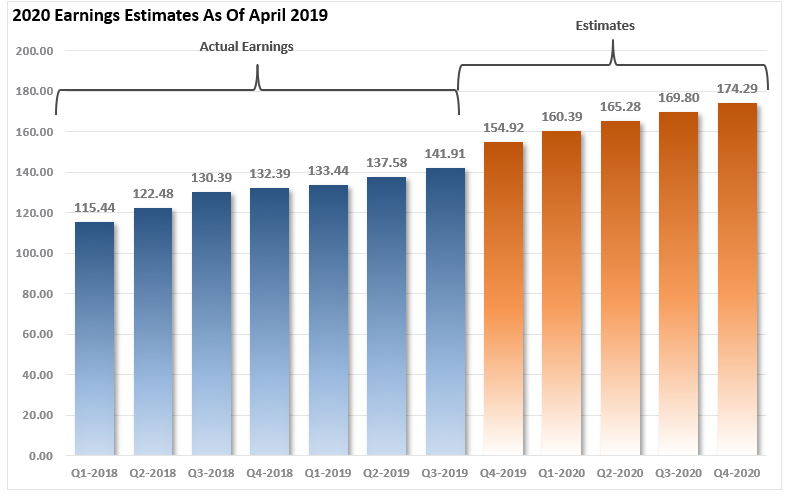
But optimism is certainly one commodity that Wall Street always has in abundance. When it comes to earnings expectations, estimates are always higher regardless of the trends of economic data. As shown, Wall Street is optimistic the current earnings decline is just a blip on the way to higher-highs.
As of April 2019, when Wall Street first published their estimates for 2020, the expectations were that earnings would grow to $174.29 by the end of next year.
The difference between Wall Street’s expectations and reality tends to be quite dramatic.
You can see the over-optimism collided with reality in just a few short months. Since April, forward expectations have fallen by more than $11/share as economic realities continue to impale overly optimistic projections.
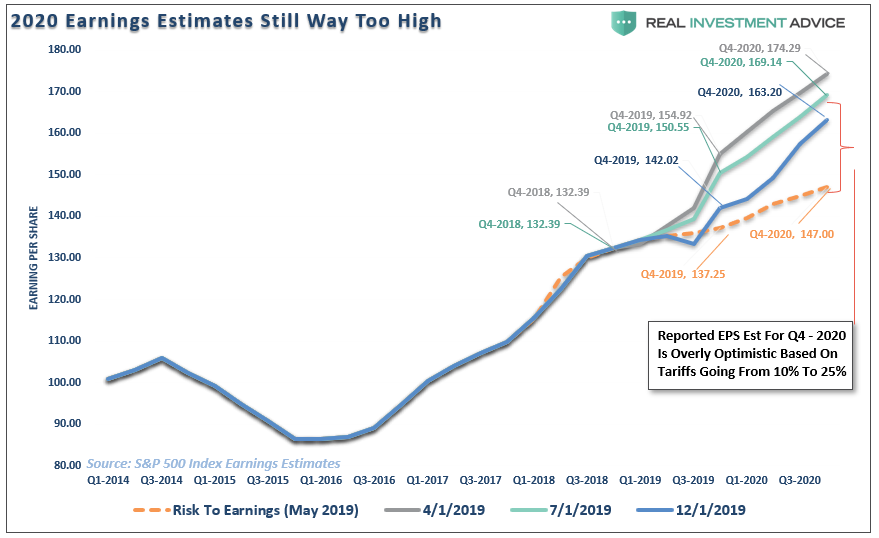
Unfortunately, estimates are still too high and have further to fall. It is very likely, particularly if “tariffs” remain in place into 2020, that the majority of expected earnings growth will be reversed.
(This shouldn’t surprise you. We previously warned that by the end of 2018, the entirely of the “Trump Tax Cut” benefit would be erased.)
The Ugly
This divergence in stock prices not only shows up in operating earnings but also in reported corporate profits. As noted previously, the deviation between prices and profits is at historically high levels which cannot be sustained indefinitely.
“If the economy is slowing down, revenue and corporate profit growth will decline also. However, it is this point which the ‘bulls’ should be paying attention to. Many are dismissing currently high valuations under the guise of ‘low interest rates,’ however, the one thing you should not dismiss, and cannot make an excuse for, is the massive deviation between the market and corporate profits after tax. The only other time in history the difference was this great was in 1999.”
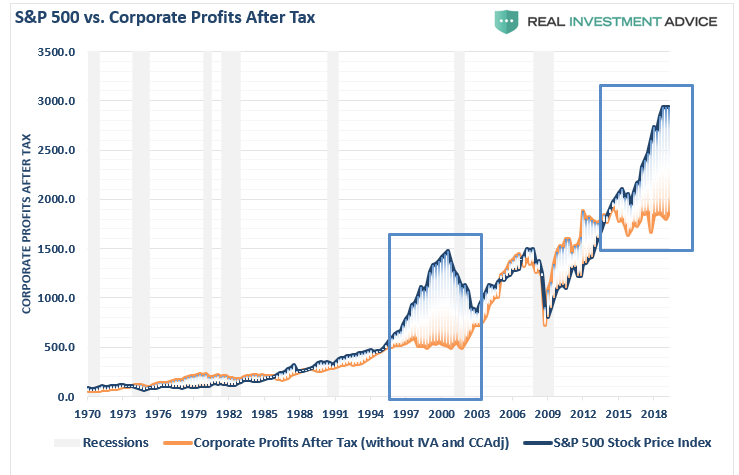
While the market has rallied sharply in 2019 on continued “hopes” for a “trade deal,” and more accommodative actions from the Federal Reserve, the deviations from fundamentals have reached extremes only seen at peaks of previous market cycles.
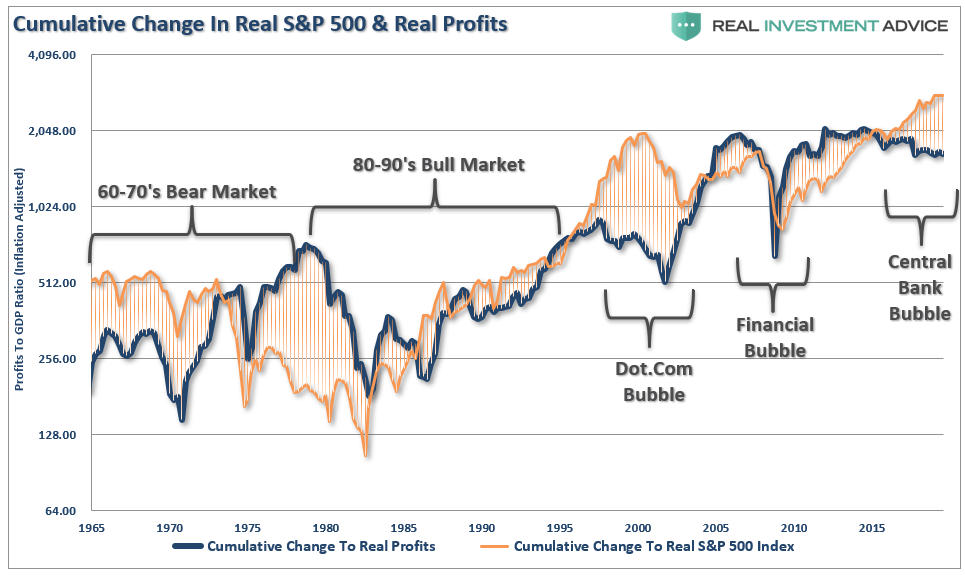
The chart below shows the real, inflation-adjusted, profits after-tax versus the cumulative change to the S&P 500. Here is the important point – when markets grow faster than profitability, which it can do for a while; eventually a reversion occurs. This is simply the case that all excesses must eventually be cleared before the next growth cycle can occur. Currently, we are once again trading a fairly substantial premium to corporate profit growth.
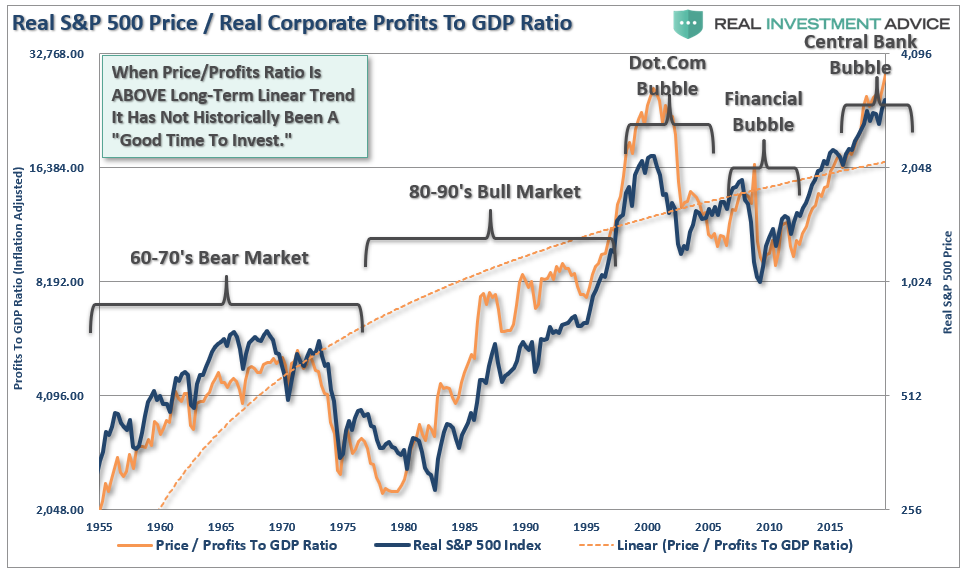
Since corporate profit growth is a function of economic growth longer term, we can also see how “expensive” the market is relative to corporate profit growth as a percentage of economic growth. Once again, we find that when the price to profits ratio is trading ABOVE the long-term linear trend, markets have struggled, and ultimately experienced a more severe mean-reverting event. With the price to profits ratio once again elevated above the long-term trend, there is little to suggest that markets haven’t already priced in a good bit of future economic and profits growth.
While none of this suggests the market will “crash” tomorrow, it is supportive of the idea that future returns will be substantially weaker in the future.
Currently, there are few, if any, Wall Street analysts expecting a recession currently, and many are certain of a forthcoming economic growth cycle. Yet, at this time, there are few catalysts supportive of such a resurgence.
- Economic growth outside of China remains weak
- Employment growth is going to slow.
- There is no massive disaster currently to spur a surge in government spending and reconstruction.
- There isn’t another stimulus package like tax cuts to fuel a boost in corporate earnings
- With the deficit already pushing $1 Trillion, there will only be an incremental boost from additional deficit spending this year.
- Unfortunately, it is also just a function of time until a recession occurs.
Wall Street is notorious for missing the major turning of the markets and leaving investors scrambling for the exits.
While no one on Wall Street told you to be wary of the markets in 2018, we did, but it largely fell on deaf ears as “F.O.M.O.” clouded basic investment logic.
The next time won’t be any different.