
by econimica
Summary
The age segments that make up the working age population are at levels typically associated with full employment.
The primary source of workforce slack over the past 50 years, females, are now experiencing declining percentages of employment.
With minimal working age population growth, full employment, no further female labor force slack; there is little further potential for labor force growth or resultant economic growth.
The BLS employment data makes a very simple statistic into an enigma wrapped in a question mark. Being the simpleton I am, I’d prefer to see only two variables…the populations versus those employed. No qualms about who is or isn’t looking for work…no unemployed or not in labor force statistics.
This article will simply show the quantity of three separate age groupings divided by employees per each age grouping. First, the young adult population versus employment among them (15 to 24 year-olds), then the same for the core (25 to 54 year-olds), and finishing up with those dreaming of retirement (55 to 64 year-olds).
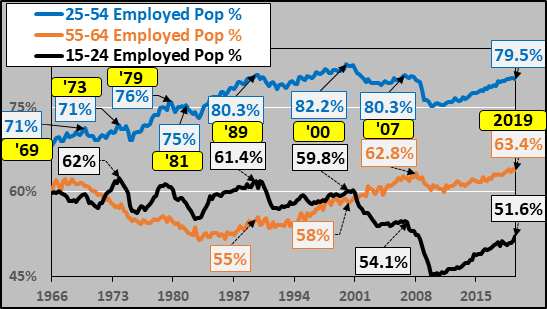
Percentage of Total Populations Employed
The percentage of young adults employed (black line, below) peaks in 1973 and has been in secular decline since. The employed percentage of the core population (blue line) rose until peaking in 2000 but has never regained that peak since. The percentage of 55 to 64 year-olds (tan line) has essentially gone full circle, declining from the early ’60’s to a low in the mid ’80’s but rising since, presently at an all time high.
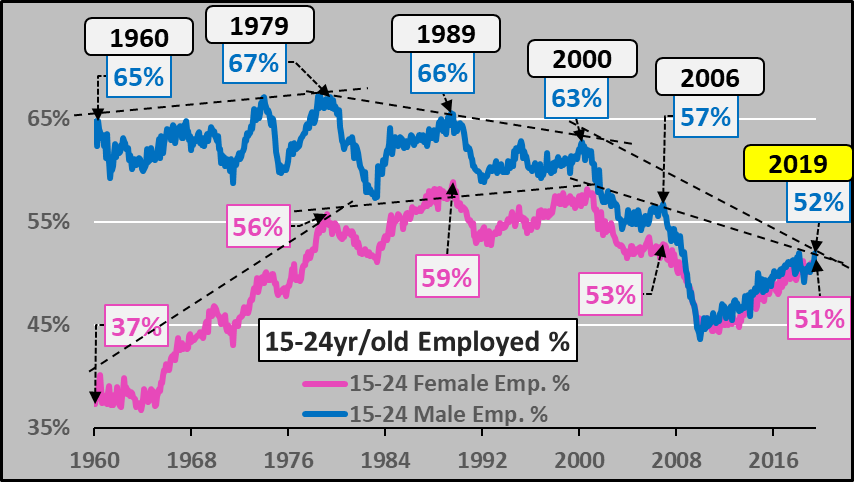
 15 to 24 Year-Olds
The young adult population (tan line) and employed among them (blue line), rose sharply from the ’50’s until 1980, chart below. Since 1980, the young adult population has been flat for four decades but those employed among them has continued to secularly decline.

But the young adult employed population of males versus females has shifted dramatically
- The percentage of employed young adult males peaked in 1979 and has been declining since, now down to just 52%.
- The percentage of employed young adult females was roughly half that of males in the early ’60’s but peaked in 1989 and has now come to match the male population.
- The total quantity and percentage of both young adult males and females continue to move lower during each economic cycle since the late ’80’s.
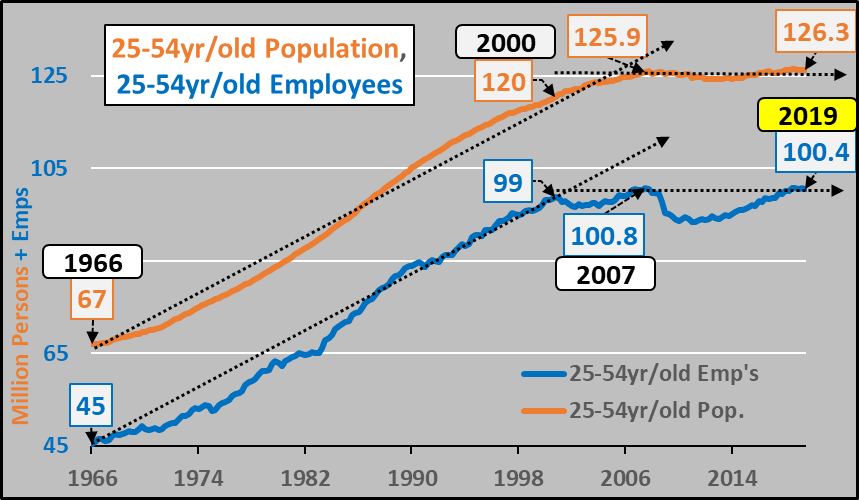
25 to 54 Year Olds
Shifting to the core population (25 to 54 year olds) that drives the economy. The core population, and employed among them, rose from the ’60’s until peaking in 2007…and since then the core population has risen less than a half million while those employed among them has fallen almost a half million.
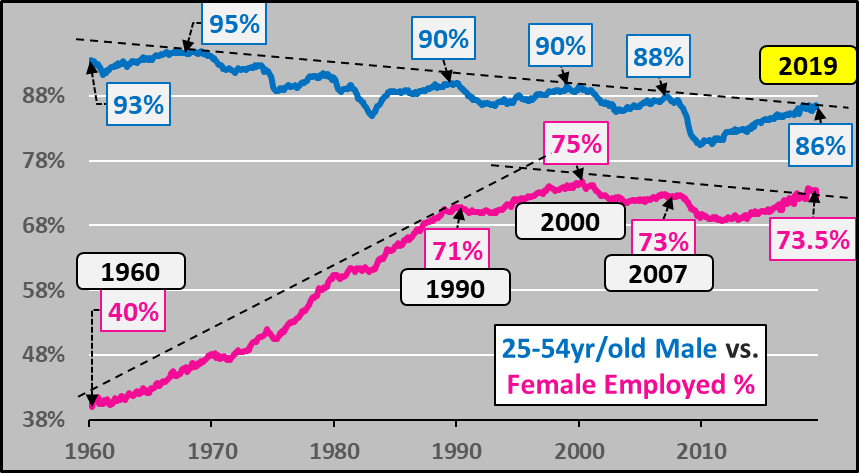
 Again, the core employed population of males versus females has shifted dramatically.
- The percentage of core males employed peaked in the late ’60’s and has been declining since, now down to 86%.
- The percentage of core females employed was less than half that of males in the early ’60’s but played catch-up for four decades, peaking in 2000.
- Since 2000, the percentage of males and females employed has continued declining
- The total quantity and percentage of both young adult males and females continue to move lower during each economic cycle since the late ’80’s.
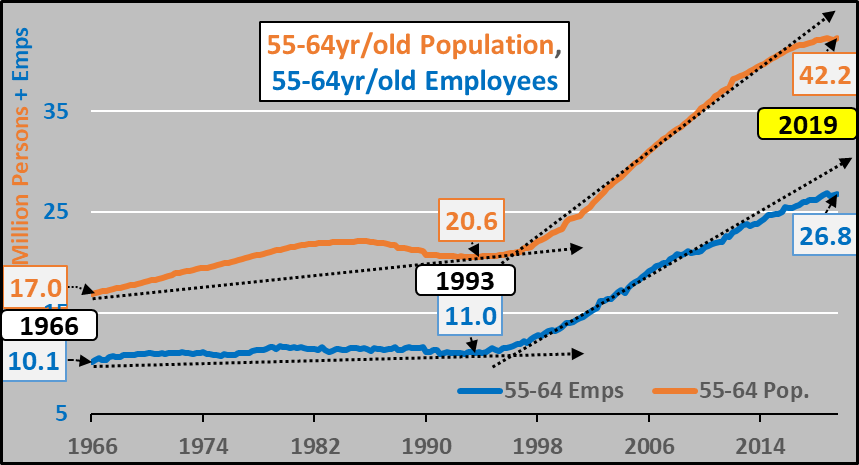
55 to 64 Year Olds
From the ’60’s until mid ’90’s, the “soon to be retired” population was essentially flat and employment among them was even flatter. However, since 1993, both the 55 to 64 year old population and employment among them has more than doubled.
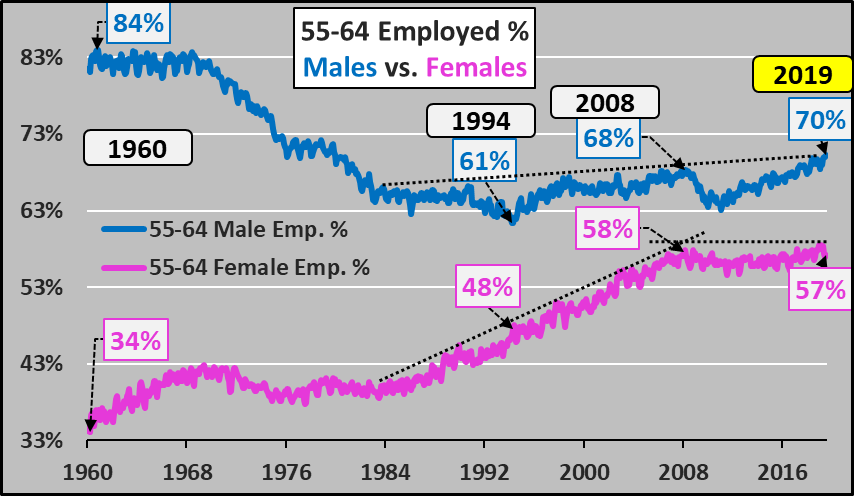
 Again, the “soon to be retired” employed population of males versus females has shifted dramatically.
- The percentage of 55 to 64 males employed peaked in the ’60’s, declined until 1994, but has been rising since, now down up to 70%.
- The percentage of 55 to 64 females employed was about one third that of males in the early ’60’s but played catch-up for five decades, peaking in 2008.
- Since 2008, the percentage of employed males has continued gently rising while the percentage of females has yet to regain the ’08 peak.
Working Age Population Growth vs. Age Group Employment %’s
Below, from 1970 through 2009, the annual working age (15 to 64 year old) population growth (black line) vacillated from from +2.7 million to a low of 1.2 million. However, since 2009, working age population growth has decelerated to just a half million. This means once the millions of unemployed, thanks to the last great financial crisis, were re-employed there is only a maximum monthly increase of 40,000 new potential employees entering the workforce.

But the chart below shows the annual 15 to 64 year old population growth (black line) from 2019 through 2030 only continues decelerating…hitting a projected low in 2028 adding just 200 thousand annually (a maximum of just 17,000 potential new employees monthly). And this is premised on high immigration rates, absent this, the annual working age population change will be negative.

The point is, with minimal population growth among the working age population over the next decade, full employment among the working age population by age segments and gender, there is minimal potential for further employment gains or resultant economic growth. Further interest rate cuts and QE from the Federal Reserve plus federal government deficit spending are incapable of creating more potential persons to enter the workforce. While these policies may (or may not, who really knows?) be capable of avoiding a fall in asset prices…real consumer based growth will be dependent on ever fewer consuming ever more…and sooner or later, there is a limit.
0 views