Authored by Lance Roberts via RealInvestmentAdvice.com,
When I was growing up my father, probably much like yours, had pearls of wisdom that he would drop along the way. It wasn’t until much later in life that I learned that such knowledge did not come from books, but through experience. One of my favorite pieces of “wisdom” was:
“Exactly how many warnings do need before you figure out that something bad is about to happen?”
Of course, back then, he was mostly referring to warnings he issued for me “not” to do something I was determined to do. Generally, it involved something like jumping off the roof with a queen-sized bedsheet convinced it was a parachute.
After I had broken my wrist, I understood what he meant.
With that in mind, there are currently plenty of warning signs individuals might want to consider before taking that leap. Here are four to consider.
Warning 1: Investor Confidence
There are several different surveys of retail investors which all currently show the same thing. Individuals have never been as hopeful as they are currently that the stock market will continue to grind higher. Last week, I discussed the Gallup poll which showed investor optimism at the highest levels since 1999.
The latest survey comes from the University of Michigan survey courtesy of Business Insider.
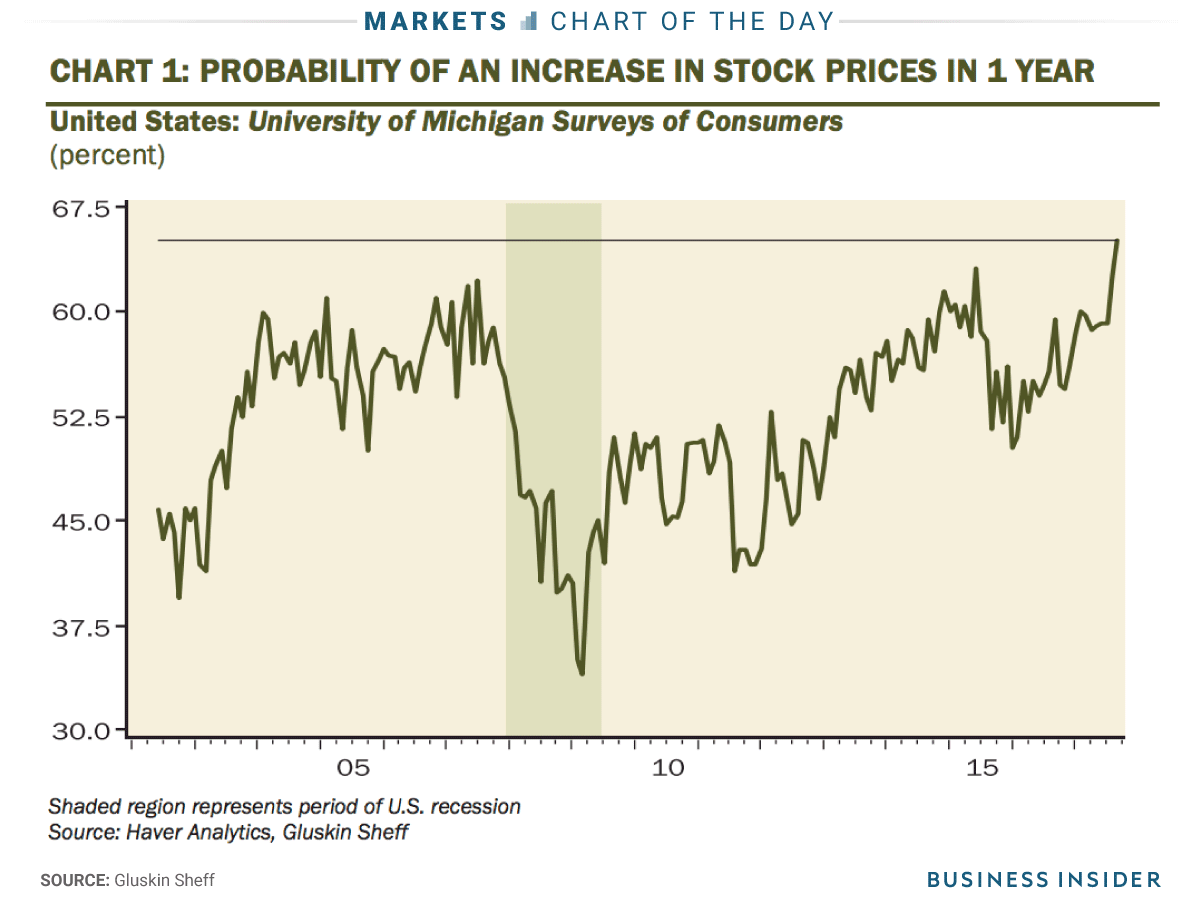
The preliminary survey of consumer sentiment for September showed a record 65% expected probability that stocks would rise in the next year. The data goes back to 2002.
As BI noted:
“The report in February noted that people who were most bullish for the year ahead, and could invest more in stocks, were in the top third of income distribution and in the top tier of stock ownership. In other words, the respondents to this survey have reaped strong gains on a riskier asset class in a short period of time and are hoping this continues.”
As I have discussed many times previously, the stock market rise has NOT lifted all boats equally. More importantly, the surge in confidence is a coincident indicator and more suggestive, historically, of market peaks as opposed to further advances.
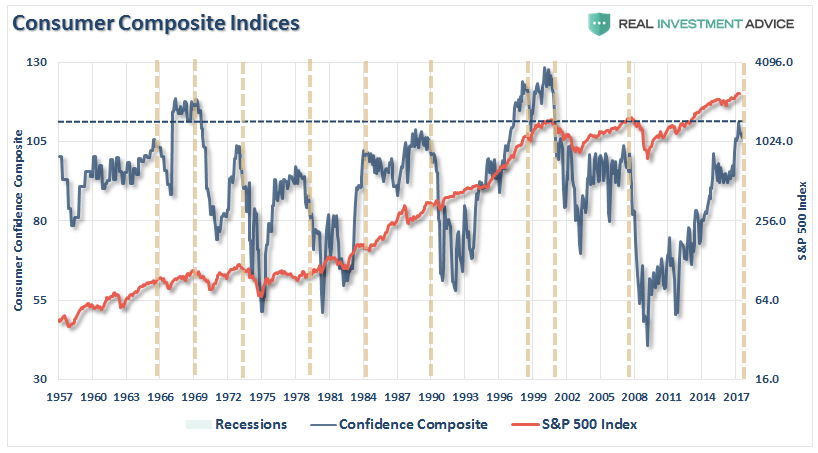
As David Rosenberg, the chief economist at Gluskin Sheff noted:
‘For an investment community that typically lives in the moment and extrapolates the most recent experience into the future, it would only fall on deaf ears to suggest that peak confidence like this and peak market pricing tend to coincide with each other.”
He is absolutely correct. As shown below in the consumer composite confidence index (an average of the Census Bureau and University Of Michigan surveys), previous peaks in confidence have been generally associated with peaks in the market.
Warning 2 – All Hat, No Cattle
For those of you unfamiliar with Texas sayings, “all hat, no cattle” means that someone is acting the part without having the “stuff” to back it up. Just wearing a “cowboy hat,” doesn’t make you a “cowboy.”
I agree with the premise that leverage alone is not a problem for stocks in the short-term. In fact, it is the increase in leverage which pushes stock prices higher. As shown in the chart below, there is a direct correlation between stock price and margin debt growth.
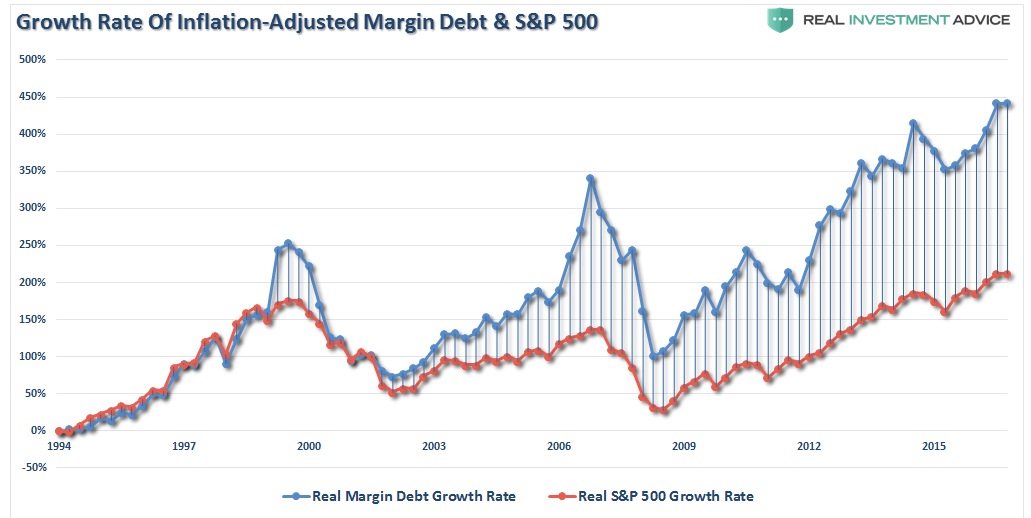
But, margin debt is NOT a benign contributor. As I discussed previously in “The Passive Indexing Trap:”
“At some point, that reversion process will take hold. It is then investor ‘psychology’ will collide with ‘margin debt’ and ETF liquidity. It will be the equivalent of striking a match, lighting a stick of dynamite and throwing it into a tanker full of gasoline.”
Not surprisingly, the expansion of leverage to record levels coincides with the drop in investor cash levels to record lows. As noted by Pater Tenebrarum via Acting-Man blog: (The following also reinforces Warning #1)
“Sentiment has become even more lopsided lately, with the general public joining the party. It may not ‘feel’ like the mania of the late 1990s to early 2000, but in terms of actually measurable data, the overall bullish consensus seems to be even greater than it was back then.
Along similar lines, here is a recent chart that aggregates the relative cash reserves of several groups of market participants (including individual investors, mutual fund managers, fund timers, pension fund managers, institutional portfolio managers, retail mom-and-pop type investors). It shows that there is simply no fear of a downturn:”
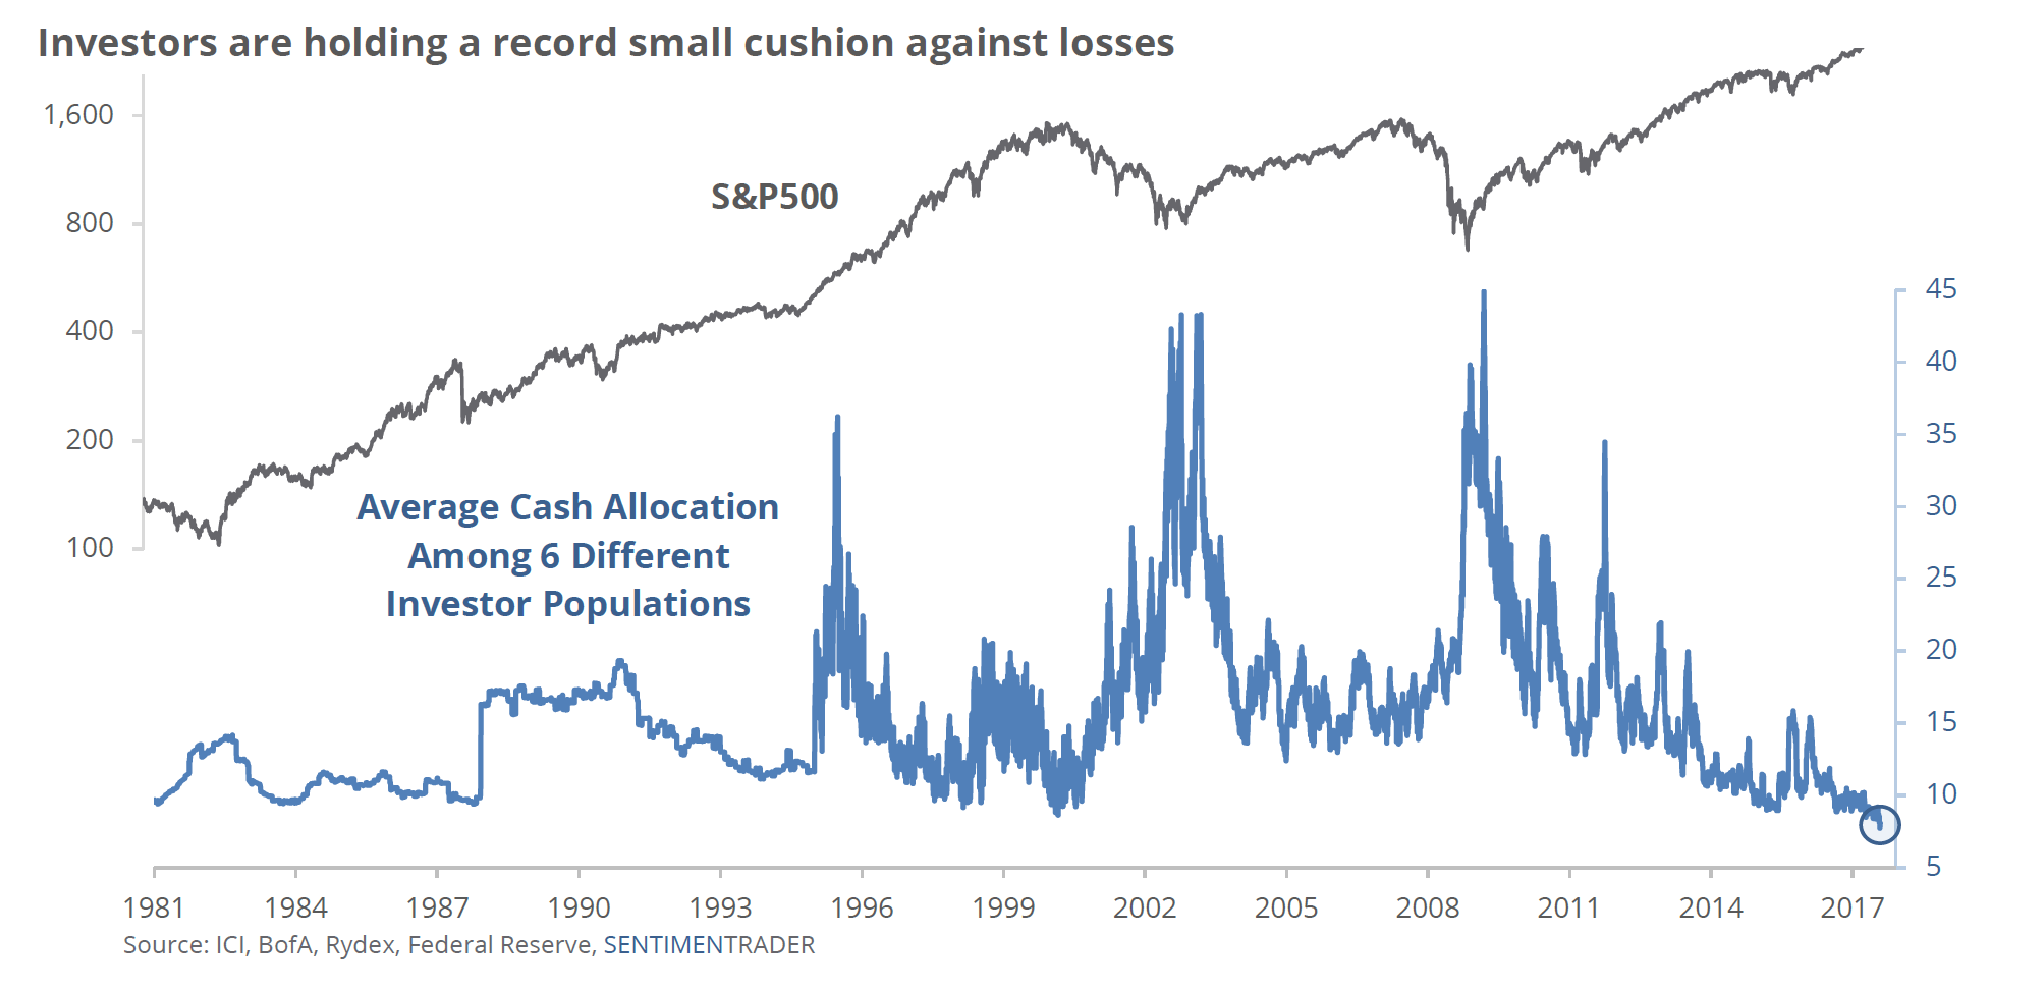
So much for the “cash on the sidelines” theory.
When investors believe the market can’t possibly go down, it is generally time to start worrying. As Pater concludes:
“As a rule, such extremes in complacency precede crashes and major bear markets, but they cannot tell us when precisely the denouement will begin.”
Warning 3 – Valuations
In an extensive, must-read report at Zerohedge, Deutsche Bank’s Jim Reid, the credit strategist unveiled an extensive analysis of the “Next Financial Crisis”, and specifically what may cause it, when it may happen, and how the world could respond assuming it still has means to counteract the next economic and financial crash. The bottom line is simple:
“With the global levels of over-valuation of stocks and bonds, combined with excessive optimism and leverage as noted above, has set the stage for exceedingly low returns over the next decade or longer.”

As noted in the report:
“With that baseline in mind, what happens next should be obvious: unless one assumes that the laws of economics and finance are irreparably broken, a deep recession and a market crash are inevitable, especially after the third biggest and second longest central bank-sponsored bull market in history.”
Valuations, as discussed most recently here, are a very poor market timing device for short-term investors. However, from a long-term investment perspective, valuations mean a great deal as it relates to expected returns.
As I addressed in “Shiller’s CAPE – Is There A Better Measure:”
“The need to smooth earnings volatility is necessary to get a better understanding of what the underlying trend of valuations actually is. For investor’s, periods of ‘valuation expansion’ are where the bulk of the gains in the financial markets have been made over the last 114 years.History shows, that during periods of ‘valuation compression’ returns are much more muted and volatile.
Therefore, in order to compensate for the potential ‘duration mismatch’ of a faster moving market environment, I recalculated the CAPE ratio using a 5-year average as shown in the chart below.”
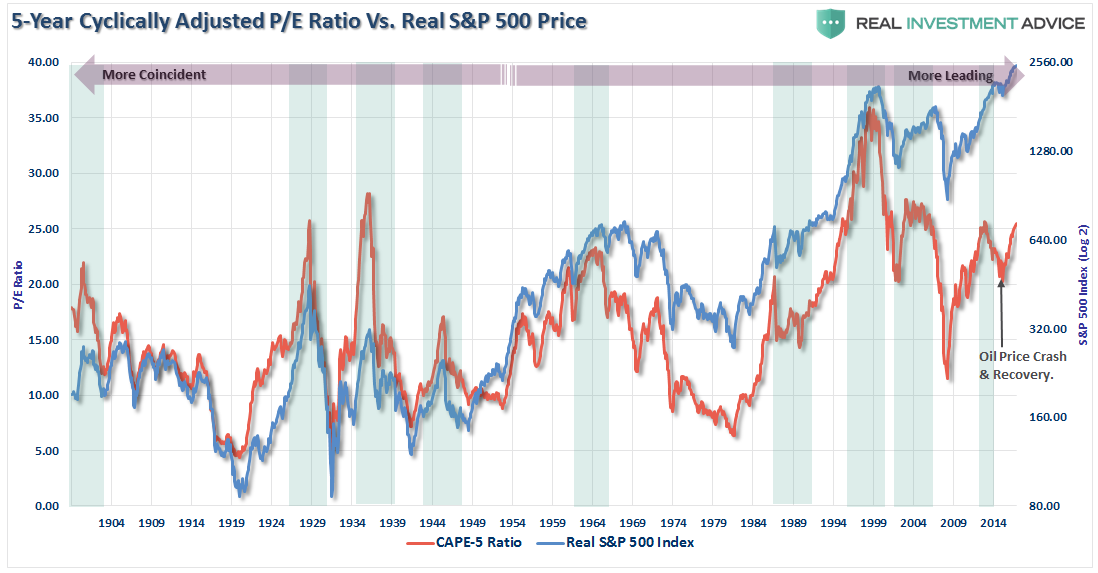
“There is a high correlation between the movements of the CAPE-5 and the S&P 500 index. However, you will notice that prior to 1950 the movements of valuations were more coincident with the overall index as price movement was a primary driver of the valuation metric. As earnings growth began to advance much more quickly post-1950, price movement became less of a dominating factor. Therefore, you can see that the CAPE-5 ratio began to lead overall price changes.
As I stated in yesterday’s missive, a key ‘warning’ for investors, since 1950, has been a decline in the CAPE-5 ratio which has tended to lead price declines in the overall market.”
Notice the downturn in the CAPE-5 ratio preceded the 2016 market swoon. However, thanks to rapid Central Bank interventions, that valuation slide was rapidly reversed is now approaching previous highs. With earnings estimates being revised lower, economic growth remaining weak, and monetary policy being reigned in, the danger to investors longer-term is mounting.
Warning 4 – Share Buy Backs
The use of “share buybacks” to win the “beat the estimate” game should not be readily dismissed by investors.
“One of the primary tools used by businesses to increase profitability has been through the heavy use of stock buybacks. The chart below shows outstanding shares as compared to the difference between operating earnings on a per/share basis before and after buybacks.”
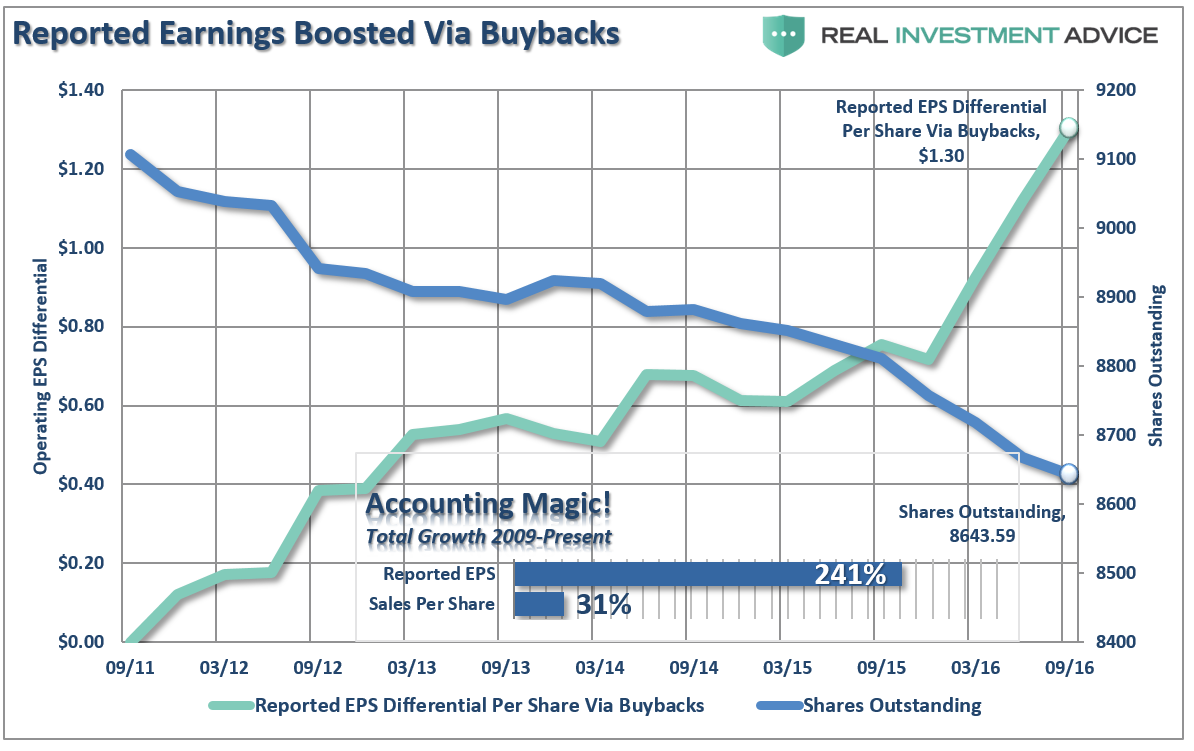
The problem with this, of course, is that stock buybacks create an illusion of profitability. If a company earns $0.90 per share and has one million shares outstanding – reducing those shares to 900,000 will increase earnings per share to $1.00. No additional revenue was created, no more product was sold, it is simply accounting magic. Such activities do not spur economic growth or generate real wealth for shareholders.
As noted by Business Insider that strategy deployed to boost share prices since the financial crisis is on the decline.
“Spending on buybacks, however, has slipped over the past six months. Investment-grade-rated corporations repurchased $64 billion worth of stock in the second quarter, down from $84 billion in the fourth quarter of 2016, according to data compiled by Bank of America Merrill Lynch.
The decline puts added pressure on the stock market, which has become accustomed to buybacks pushing shares higher during lean times when real fundamental catalysts aren’t present.”

Like margin debt, exuberance and valuations, investors have little need to worry about the decline in share buybacks in the short-term.
As BI concludes:
“The real test will come at the first sign of downward turbulence.”
If They Don’t “Buy & Hold” – Why Should You?
Of course, these are just “warning signs.” None them suggest that the markets, or the economy, are immediately plunging into the next recession-driven market reversion.
But they are warning signs nonetheless. Past experience suggests that future returns are likely to be far less than historical averages suggest. Furthermore, there is a dramatic difference between investing for 30 years, and whatever time you personally have left to your financial goals.
While much of the mainstream media suggests that you “invest for the long-term” and “buy and hold” regardless of what the market brings, that is not what professional investors are doing.
The point here is simple. No professional, or successful investor, every bought and held for the long-term without regard, or respect, for the risks that are undertaken. If the professionals are looking at “risk,” and planning on how to protect their capital from losses when things go wrong, then why aren’t you?
Exactly how many warnings do you need?