Originally posted at RecessionAlert.com
The Federal Reserve Funds Rate (Fed Funds Rate) is the interest rate that banks charge other banks for lending them money from their reserve balances on an overnight basis. By law, banks must maintain a reserve equal to a certain percentage of their deposits in an account at a Federal Reserve bank. Any money in their reserve that exceeds the required level is available for lending to other banks that might have a shortfall.
The chart below tracks the Fed Funds rate and US recessions since 1954:

We notice some very important things from the above chart:
- The Fed Funds Rate has been on a definite, persistent decreasing trend since 1982, shown by the red box.
- The effects of aggressive quantitative easing pushed the Fed Funds Rate to near zero for 7 years from December 2008 to December 2015.
- In 9 of 12 cases, when the Fed finally lowers rates in a tightening cycle, recession already is, or shortly will be, upon us.
Economists use the federal funds rate in many economic models, but since it hit zero, and monetary policy entered “zero lower bound”, it stopped proving useful and even broke many of the models. For seven years, the rate hardly moved at all and therefore had no utility in providing additional information to any quantitative models.
In fact, this unprecedented situation was used as an argument from the “this time is really different” camp for all manner of economic proclamations such as why the yield curve is no longer valid as a recession predictor and so forth.
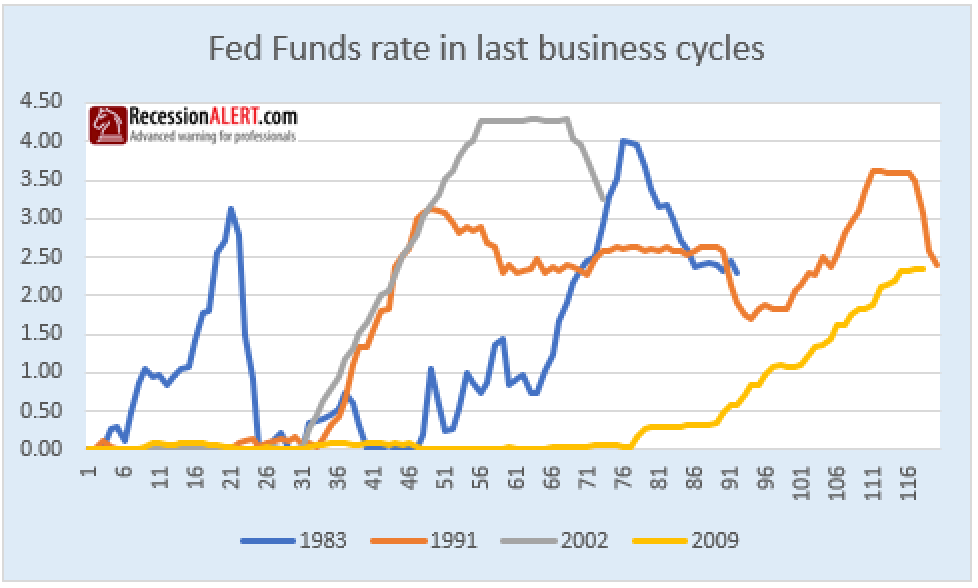
The “zero lower bound” created other problems too. For example, when trying to examine the current tightening cycle in relation to past ones, to try and gauge if we are due an easing cycle, the seven years of near zero rates leaves an uneasy feeling about reading anything into the comparisons. The chart below shows the current tightening cycle as being rather mediocre compared to past examples, suggesting that we have quite a bit of tightening headroom left:
There are two ways we can cater for this “zero bound” issue to allow us to still use the old economic models and comparison methods. The “De-trended Fed Rate” and the more sophisticated “Shadow Fed Rate”.
1. The De-trended Fed Funds Rate
We observed in the previous section that the Fed Funds Rate has been on a persistent downward trend since 1982:

We can de-trend the Fed Funds Rate around its linear regression trend line since 1982 as shown below, where remarkably, we are exactly at the +2 standard deviations point:

Apart from the deviation from mean method described above, we can also do an absolute like-for-like comparison of the current rate rise to past ones:

These two comparisons using the de-trended Fed Funds rate clearly show a far different picture in terms of the current tightening cycle than the traditional comparison made four charts back. It is quite possible that the majority of market participants are underestimating the extent and duration of the current rate-tightening cycle. Clearly one could now deduce that we are indeed “overdue” a fed funds rate decrease, or a new easing cycle!
2. The “Shadow” Fed Funds Rate
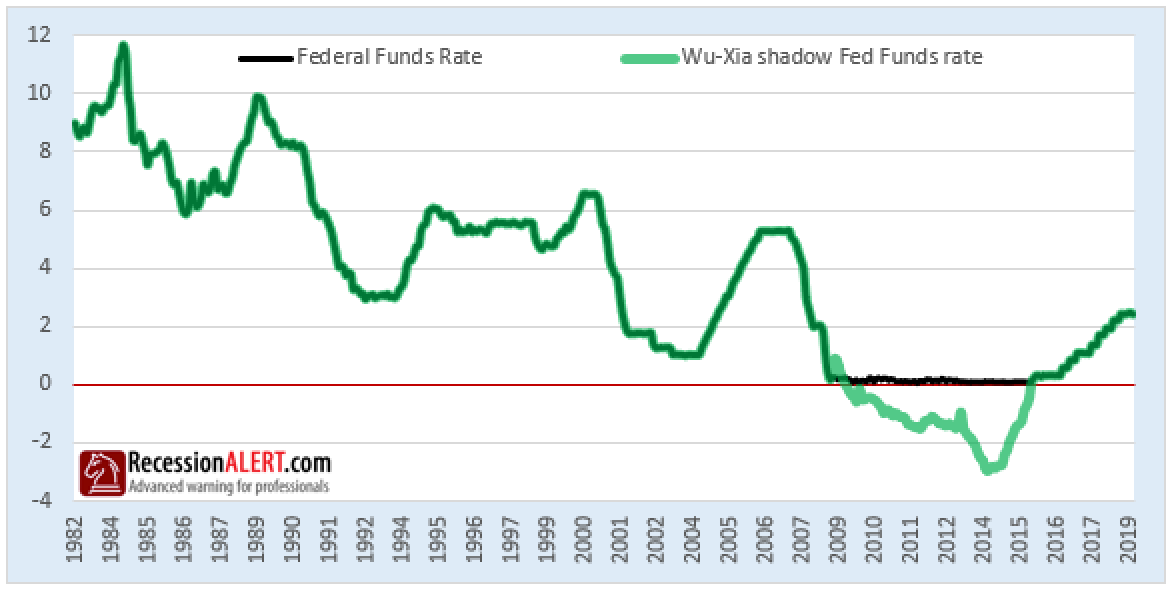
From December 2008 to December 2015, the effective federal funds rate was in the 0 to 0.25% range targeted by the Federal Open Market Committee. In this “zero lower bound” environment, a number of researchers used shadow rate models to characterize the term structure of interest rates (Kim and Singleton (2012) and Bauer and Rudebusch (2013)) or quantify the stance of monetary policy (Bullard (2012) and Krippner (2013)). The one that interests us the most however, is estimates from the Wu and Xia (2015) model of the shadow rate.
Unlike the observed short-term interest rate, the shadow rate is not bounded below by 0 percent. Whenever the Wu-Xia shadow rate is above 1/4 percent, it is exactly equal to the model implied one-month interest rate by construction. But when the Fed Funds rate falls below 0.25% we replace it with the shadow rate.
The input data for the Cynthia Wu and Fan Dora Xia model are one-month forward rates beginning n years hence. Wu and Xia use forward rates corresponding to n = 1/4, 1/2, 1, 2, 5, 7, and 10 years. These forward rates are constructed with end-of-month Nelson-Siegel-Svensson yield curve parameters from the Gurkaynak, Sack, and Wright (2006) data set. In short, the shadow rate is assumed to be a linear function of three latent variables called factors, which follow a VAR(1) process. The latent factors and the shadow rate are estimated with the extended Kalman filter:
This now allows us to use an absolute movement method to compare the current tightening cycle to prior ones:

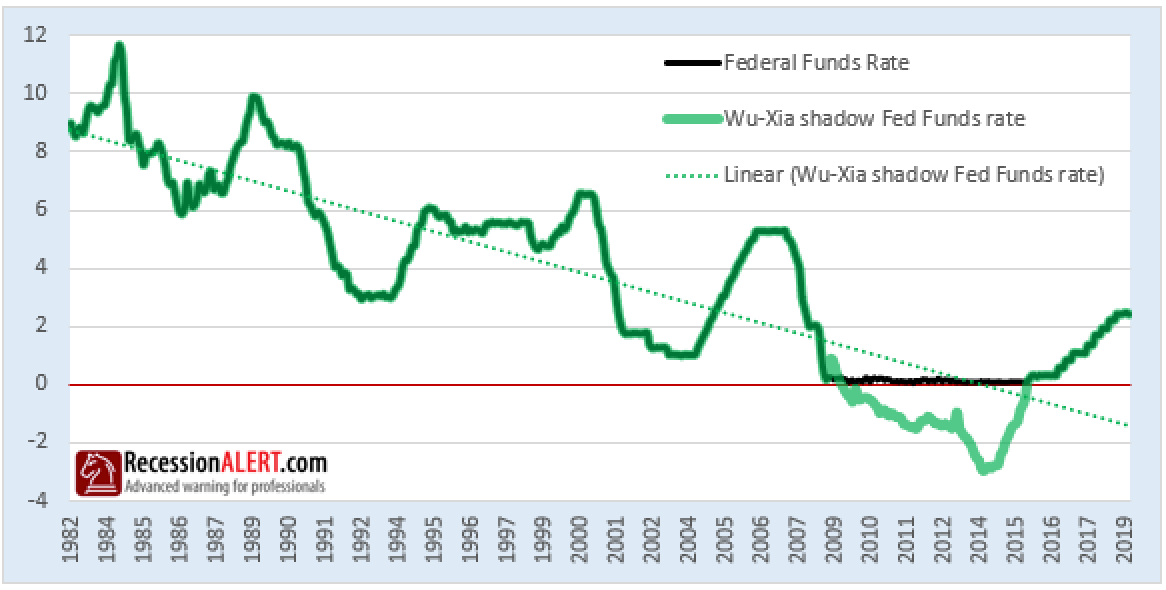
Despite the above chart shouting “time for a rate cut!” from the rooftops, we can use de-trending to obtain a more conservative picture. As shown below, the Wu-Xia shadow Fed rate seems to continue that multi-decade long decreasing trend we witnessed for the “vanilla” Fed Funds rate:
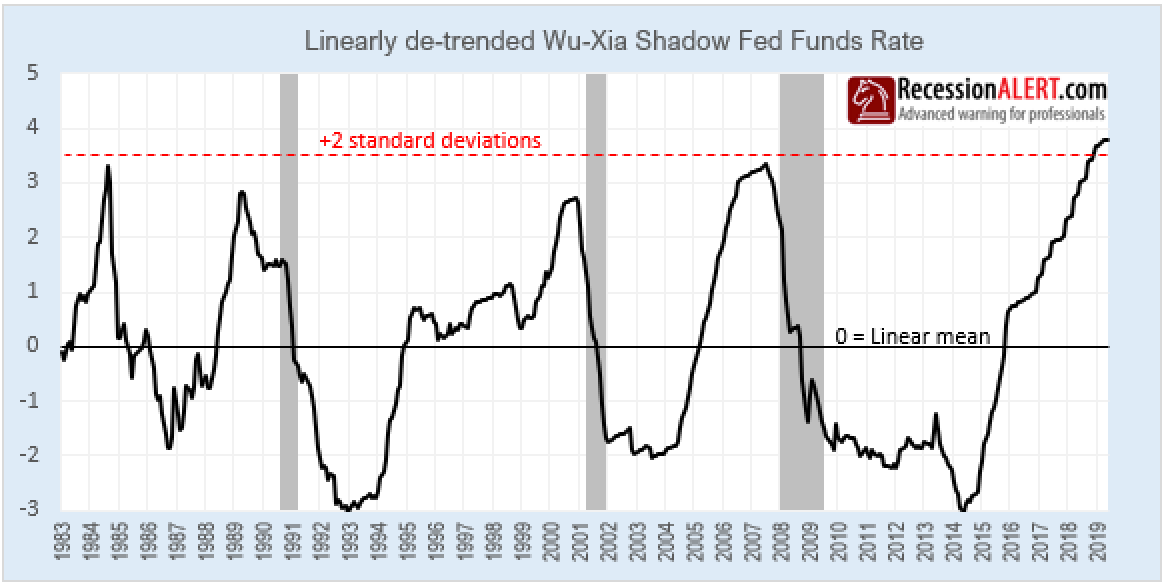
As with the de-trended Fed Funds rate in Section-1, we have two tools to measure the de-trended shadow Fed rate tightening cycle to prior ones, namely “deviation from trend” and “absolute movement.” The deviation-from-trend is shown below where we are a little higher above two standard deviations than with the de-trended vanilla Fed Funds rate:
Now let us examine absolute movement:

Comparisons
Let us examine the 3 main comparisons available to us from this research. Firstly, here is the absolute movement comparison which shows the vanilla Fed rate saying we have loads more headroom for tightening and the shadow rate showing the exact opposite, suggesting we are out of tightening headroom:

Secondly, here is the de-trended absolute movement comparison, with the de-trended shadow rate still showing no more tightening headroom and the de-trended vanilla Fed funds rate showing a tiny bit of tightening headroom available:

…and thirdly, here is the de-trended deviation from mean comparisons, both showing we are on or over +2 standard deviations from the mean and most likely out of headroom:

So out of six possible ways of comparing the current tightening cycle to prior ones, all but the one most investors are watching are telling us the tightening era is most likely coming to an end. When it does, the FED might be behind the curve again with the business cycle peaking anywhere from 5-15 months after the first rate drop.