Wolf Richter wolfstreet.com, http://www.amazon.com/author/wolfrichter
Trade goes out-of-whack as Corporate America searches for cheap labor & tax benefits.
Exports increase economic activity as measured by GDP; and imports do the opposite, they reduce GDP though they tend to increase corporate profits — or else why would Corporate America run its supply chains around the world? So a trade deficit is a net negative for the economy. And this is what we got today from the Commerce Department:
- US trade deficit in goods jumped by 10.4%, or by $84 billion to $891 billion, after having jumped 7.5% in 2017 (to $552 billion). Worst trade deficit in goods ever.
- US trade surplus in services improved by 5.9% or by $15 billion, to $270 billion, edging out the prior record of 2015.
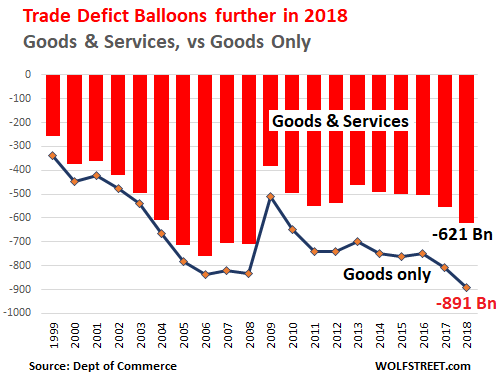
- US trade deficit in goods and services jumped 12.4%, or by $69 billion, to $621.0 billion, after it had already jumped by 10% in 2017. The worst trade deficit in goods and services since 2008.
Exports of goods and services rose by $149 billion to $2.5 trillion, as imports surged by $218 billion to $3.12 trillion. The chart shows the annual trade deficit in goods and services (red columns) versus the deficit in goods only (black line):
The Goods Deficit
Exports of goods increased by $118 billion in 2018, to $1.67 trillion. One third of this increase was the $39-billion increase in exports of crude oil and petroleum products.
Imports of goods rose by $202 billion to $2.56 trillion. The largest categories of imports:
- Capital goods (computers, electrical equipment, etc. but not automotive): +8.2% to $693 billion
- Industrial supplies and materials (including crude oil): +13% to $576 billion
- Consumer goods, except automotive: +7.6% to $647 billion
- Automotive vehicles and components: +4% to $372 billion
- Food, feeds, and beverages: +7%, to $147 billion
A special word about “pharmaceutical preparations,” the legal kind: imports surged 21% to $134 billion. This is now the largest sub-category of Consumer Goods – because more and more of your prescription drugs are made in other countries. In 2016, pharma products blew past cellphones, currently the second largest category, stagnating at around $108 billion.
Below are the 14 countries with which the US has the largest trade deficits in goods (services not included). I put China and Hong Kong together since a lot of merchandise is transshipped and/or invoiced via Hong Kong. I included the EU (purple bar) for memo purposes, though it is not a country and though some member states are also included in the chart:
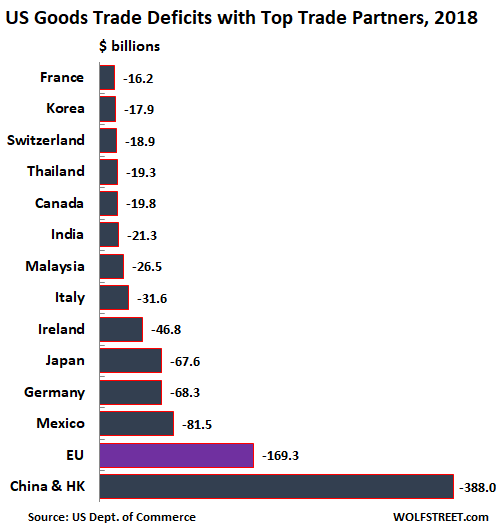
Some special words about the countries with which the US has the largest goods trade deficits:
- China and Hong Kong: the deficit soared 13.5%, or by $45 billion, to a phenomenal $388 billion, after having jumped 7% in 2017. Imports rose by $33 billion, and exports actually dropped by $13 billion.
- Mexico: the deficit increased by $10.5 billion, as imports and exports surged by 10.2% and 9.1% respectively.
- Germany: the deficit remained about flat.
- Japan: the deficit declined a smidgen, by $3 billion.
The opaque nature of trade dealings – transshipments, trade invoicing, tax issues, etc. – along with issues of ports of entry, etc., can produce peculiar results. For instance, the US had a trade surplus of $25 billion with the Netherlands and of $14 billion with Belgium, and not because the end-users of US products are in the Netherlands and Belgium. And the US had a huge trade deficit of $47 billion with tiny Ireland (up from $38 billion in 2017) where many US companies shelter part of their profits from US taxes.
The chart below shows US imports (red) and exports (black), in order of the trade deficit:
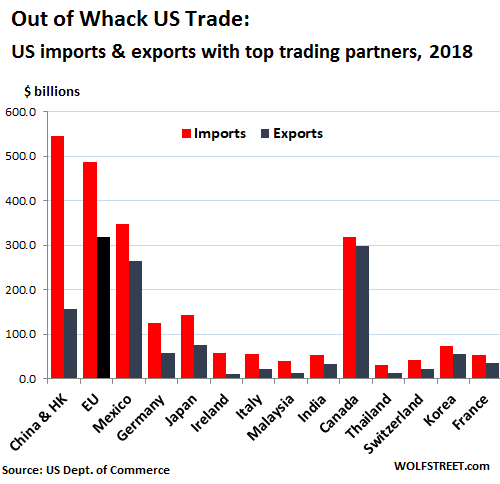
Here are the ratios of imports to exports by top country. A value of “1” means that trade is balanced, with imports equaling exports. A value of “3.5” means that US imports from the country are 3.5 times the size of US exports to that country:
- China/Hong Kong: 3.5
- Germany: 2.2
- Japan: 1.9
- Mexico: 1.5
- Canada: 1.1 (trade in goods is almost balanced).
This indicates that the US has a booming bilateral trade in goods with Canada that is almost balanced. If services are included, the trade relationship is balanced.
It also shows that Corporate America has routed its supply chain so deeply into China that by now 3.5 times as many goods are imported from China to the US than are exported from the US to China.
Corporate America is largely responsible for the trade deficit. No one forces companies to run their supply chains through China and around the world. Incentives in the US tax code and cheap labor overseas make it very profitable.
While the systems in China, Japan, and Germany coddle their local exporters, and impede imports, the US system does the opposite: It coddles US importers, and they range across the spectrum, from Walmart and GM to Apple and Pfizer. And these importers ruthlessly take advantage of what the system offers them.