via upfina:
Even though stocks have done well in the past few months outside of the recent August correction, fund managers have been consistently bearish. Either they will be proven right or the negative sentiment will provide jet fuel for a stock market rally. Perhaps a little of both, it depends on your time horizon. As you can see from the chart below, the only previous time sentiment on global equities was this negative was in the 2008-2009 financial crisis. The difference between then and now is stocks haven’t fallen much yet.
BoA ML GFMS asset allocation to global equities
a bit disconcerting when you notice that we don't see this much pessimism other than during bear markets pic.twitter.com/7LGNHTh8Bl
— Babak 🇺🇦 🌻 (@TN) August 13, 2019
As you can see, the 60-30-10 basket had more of a decline in 2016 than now, but now the net percentage of fund managers saying they are overweight equities is significantly lower. There probably needs to be more economic weakness to justify a bigger decline in equities. The recent service sector PMI wasn’t recessionary.
Geopolitics might be a big reason for this negative sentiment. The Argentinian election, the trade war, and the Hong Kong protests all are negative catalysts for stocks and sentiment. Plus, the manufacturing PMI is in contraction territory. The z-score of fund manager positioning furthers the notion that investors are nervous about risk assets. Cash had the highest z score (about 1.5) and equities had the lowest z score (about -1.7). America had a modestly positive reading. The fiscal stimulus helped the US economy outperform in 2018.
Core CPI Increases In July
With the Fed likely embarking on a cutting cycle, since it cut rates in July and there’s a 100% chance of a cut in September, it wants to see core inflation below 2%. That’s not what the Fed got from the July CPI report which wasn’t in tune with the PPI report. Core PCE inflation will probably still be below 2%, but this increase in core inflation pressures the Fed and lowers the odds of future rate cuts. The decline in rate cut odds is partially why the difference between the 10 year yield and the 2 year yield has shrunk. It finally inverted on Wednesday.
Specifically, headline inflation was 1.8% which beat estimates for 1.7% and June’s reading of 1.6%. Headline inflation is still below core inflation because of the decline in energy prices. Energy prices fell 2% in this report. Monthly core CPI was 0.3% which beat estimates for 0.2% and was on top of the 0.3% rate in June. Those back to back strong readings explain why the chart below shows there has been a big increase in annualized quarterly core inflation. Unlike core PPI, which has been falling, core CPI has been stable. In July it rose from 2.1% to 2.2% which beat estimates by 0.1%.
'The so-called core consumer-price index, which excludes volatile food and energy categories, was up 0.3% in July from June and 2.2% from a year earlier.' https://t.co/8mzJoW785v pic.twitter.com/ty9pCL4h5p
— Jesse Felder (@jessefelder) August 13, 2019
Details Of CPI Report
None of the relative performances were a surprise in this CPI report; the size of the price increases in some of the readings was the surprising aspect. For example, everyone knew energy inflation was going to be weak and shelter inflation would be strong, but the fact that shelter inflation was 3.5% was notable. Medical care services inflation was also high as it was 3.3%. Those two categories drove the 2.8% services less energy services inflation rate. Hospital services inflation was only 0.77%. As you can see from the chart below, healthcare services inflation was driven by health insurance inflation which was 15.88% which is a record high.
CPI for health insurance continued to surge, now up 15.88% y/y. Remember, this is a residual, but I think that means it may signal changes that the BLS hasn't picked up yet. It's the highest on record. pic.twitter.com/HE84VqkHpr
— Michael Ashton (@inflation_guy) August 13, 2019
Core commodities inflation was low again as it was only 0.4%. However, there is a diversity of inflation within it. Medical care commodities inflation was -0.4%, while tobacco and smoking products inflation was 5.4%. Tobacco inflation has been elevated in recent reports. New vehicle inflation was just 0.3%, while used vehicle inflation was 1.5%. Food inflation was 1.8%. Food at home inflation was 0.6% and food away from home inflation was 3.2%. Interestingly, meats, poultry, fish, and eggs inflation was 0%. Finally, in the energy category, fuel oil prices fell 6% and electricity prices were up 0.5%.
Small Business Confidence Remains Elevated
Despite the worries about the trade war and the May and June ADP reports showing small businesses created negative jobs, the July NFIB small business optimism report showed continued strength. Some have previously stated that small business confidence means the business cycle is ending, but these readings have been strong for 2 years. There appears to be a bias in favor of Republicans in this survey. It would be a big mistake to sell stocks for the sole reason that small businesses are confident, considering it a contrarian indicator, partially because a Republican is president.
Specifically, the NFIB sentiment index improved from 103.3 to 104.7 which beat estimates for 103. As you can see from the table below, this improvement was driven by a 5% jump in the net percentage of firms expecting real sales to be higher and a 4% increase in the net percentage expecting the economy to improve.
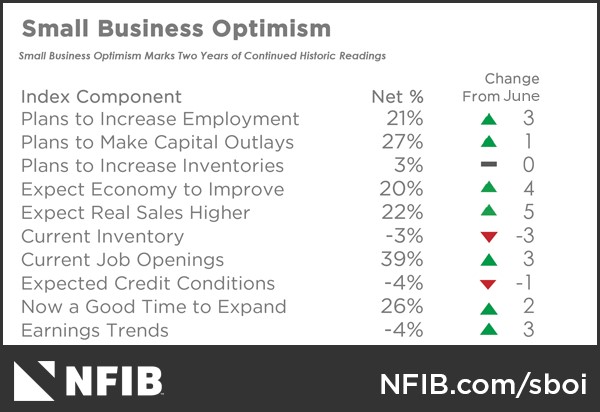
The only sequential weakness was the 1 point decline in net expected credit conditions. The recent volatility in stocks has tightened financial conditions.
Is Anyone In Control In The Trade War?
President Trump announced that some of the tariffs (10% rate on $300 billion worth of goods 40% of which were supposed to be consumer goods) set to be enacted on September 1st will be delayed until December 15th. The idea is to limit the impact on the consumer during the holiday shopping season. The items being delayed include smartphones, laptops, video game consoles, some clothes, shoes, and certain toys. Some say President Trump showed his weak point in these negotiations.
The concept that China is in great shape is far from correct based on the latest economic data from July. The results were terrible. As you can see from the chart below, industrial production growth fell from 6.3% to 4.8% which was the slowest pace since February 2002.
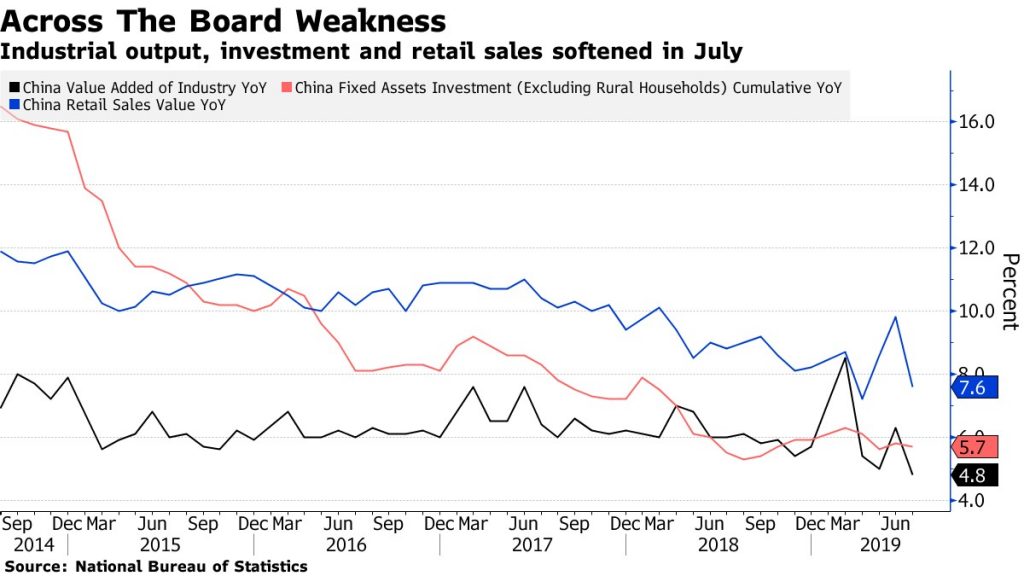
Economists expected 5.8% growth. Fixed asset investment growth was 5.7% year to date which missed estimates for 5.8% growth. Private sector fixed asset investment growth was 5.4% year to date which was down from 5.7% in the first 6 months of the year. Finally, retail sales growth fell from 9.8% to 7.6% which missed estimates for 8.6%.
Conclusion
Fund managers are very cautious on global equities as they are long cash. Core CPI increased in July. If core PCE increases in the next few months, it will be tougher for the Fed to cut rates further. This explains why the yield curve has flattened. Despite trade war worries, small business confidence is high just like it has been for the past 2 years. Finally, Trump delayed some of the tariffs on China until December 15th to help the consumer. The July Chinese economic data was terrible. Neither country is in a position of strength to negotiate a trade deal.