Wolf Richter wolfstreet.com, http://www.amazon.com/author/wolfrichter
They shot up by far the most in Dallas. Manhattan turned south last year.
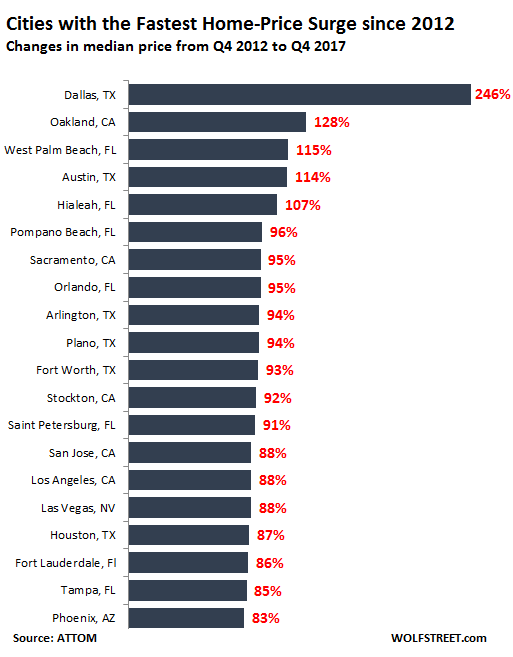
Among the 100 largest cities in the US, where did home prices soar the fastest over the past five years since 2012? No, it wasn’t San Francisco or any of the other housing markets where you need to have a top-notch income to buy a starter shack. And in five of these cities, home prices surged over 100% since the fourth quarter of 2012:
The winner (a dubious honor) is Dallas, TX.
From Q4 2012 through Q4 2017, the median home price in the city of Dallas skyrocketed 246%. In other words, during those five years, it multiplied by nearly three-and-a-half times, from $82,300 to $284,600. Since Q1 2008, just past the peak of Housing Bubble 1, prices have shot up 182%. Here are the next four cities in line:
Oakland, CA, is second. The median home price soared 128% in those five years, from $439,000 to $660,000. It is now 50% above the peak of Housing Bubble 1.
West Palm Beach, FL, is third. Its median price, at $200,000, soared 115% over those five years.
Austin, TX, is in fourth place. The median price, at $361,000, has shot up 114% over those five years.
Hialeah, Miami-Dade County, FL, is fifth. The median home price, at $237,500, has jumped 107% in five years.
The data I cite here was provided by ATTOM Data Solutions, the curator of ATTOM, a multi-sourced national property data warehouse. Note that these are the median prices: in each city, 50% of the homes sold for more, and 50% sold for less.
The entities are cities – not metro areas or Metropolitan Statistical Areas (MSA). The exception is New York City which is represented by its boroughs rather than the City as a whole. Also, median-price data is very different from the “sales pair” data used in the Case-Shiller home price index, though over time they move in parallel. Using the Case-Shiller data, here’s my most recent Update on the Splendid Housing Bubbles in US Cities.
The 20 Cities with the fastest 5-year price growth
Below are the 20 cities where home prices have surged the most among the 100 largest cities, starting in 2012. North Texas is represented by four entries on this list – Dallas, Arlington, Plano, and Fort Worth. In 12th place is Stockton, CA, one of the two cities near San Francisco that went bankrupt (2012) after the onset of the Financial Crisis. Since then, the median home price has surged 92% to $250,000. That may sound like a good deal for people who work in San Francisco, but they pay for it with a horrendously long and arduous commute.
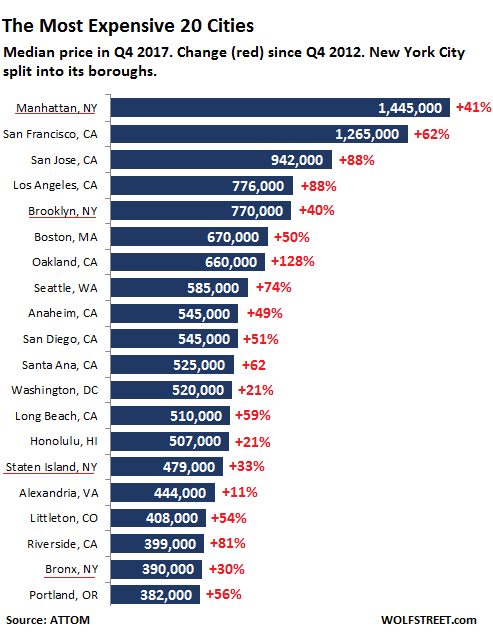
The 20 most expensive cities
In terms of the 20 most expensive cities, a different picture emerges. In the chart below, ATTOM’s data separates New York City by borough: four of them made the list, which I underlined in red. This shows of the vast differences in median home prices across the City, ranging from $1,445,000 in Manhattan to $390,000 in the Bronx. With all boroughs lumped together, the resulting median price for New York City would be in second place, after San Francisco, which reigns supreme in this home price craziness.
The respective price surges over the five year period since Q4 2012 are marked in red. None of the cities in North Texas whose prices have exploded has made this list yet:
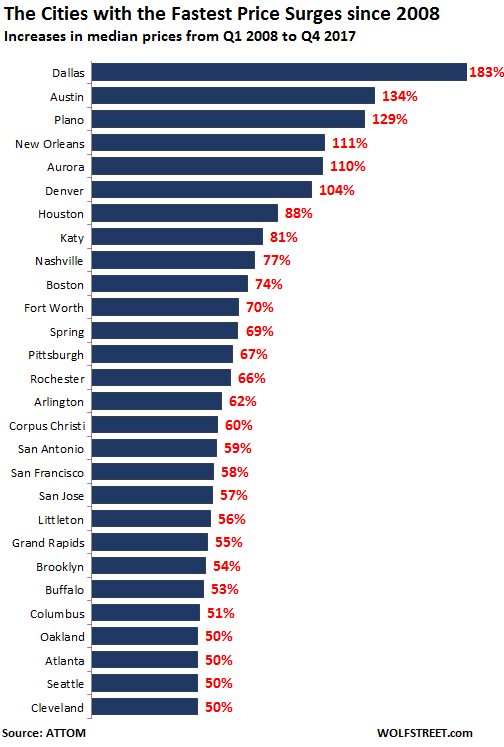
The 10-year price surge since the last bubble
In terms of gains since Q1 2008 – when Housing Bubble 1 was peaking in some cities, such as San Francisco, or had already started deflating in other cities a year or two earlier: Over this decade that includes most of the housing bust, there were 28 cities where prices surged between 50% and 183%. Dallas is once again the winner:
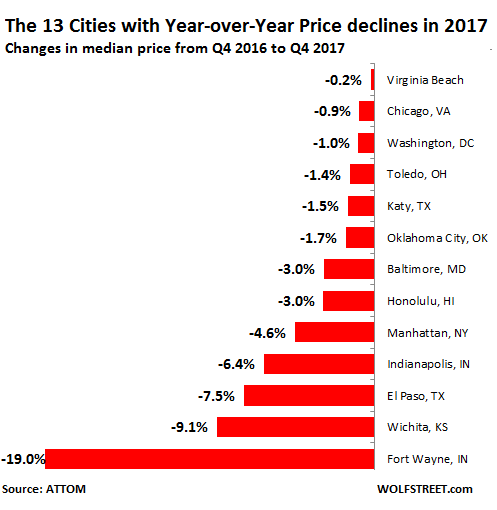
Nevertheless, there are some losers
Over those five years of blistering home price inflation, two cities, of the 100 largest ones, actually experienced declining home prices:
- Fort Wayne, IN: The median price in Q4 2017 was $83,500, down 25% from the more recent peak in Q1 2013 of $111,600 and down 13% since Q4 2012.
- Birmingham, AL: The median price in Q4 of $174,000 is down 32% from Q4 2012.
But 2017 was rough on some cities. In Q4, on a year-over-year basis, the median home price fell in 13 cities of the 100 largest. This includes super-high-priced Manhattan where the median home price in Q4 declined 4.6% year-over-year:
The whole schmear
The table below lists the 100 largest cities by population size. New York City is represented by the boroughs, rather than in one lump-sum figure. New York City as a whole is by far the largest US city, with a population of over 8.5 million. If its five boroughs were cities on their own, Brooklyn would be the third largest city in the US.
There are a number of cities on this list whose median home price increased sharply since Q1 2012 but hasn’t yet re-attained the bubble level of Q1 2008, including Chicago, Miami, and Orlando.
The US national median data is at the bottom of the table. You can use the search functions in your browser to find a specific city.
| City | Pop. Millions | Q4 2012 | Q4 2017 | YoY % | 5-Yr % | 10-yr % |
| Houston | 3.06 | $109,583 | $205,000 | 1.0% | 87% | 88% |
| Chicago | 2.70 | $150,500 | $223,000 | -0.9% | 48% | -7% |
| Brooklyn | 2.60 | $550,000 | $770,000 | 5.5% | 40% | 54% |
| Los Angeles | 2.43 | $412,000 | $776,000 | 11.9% | 88% | 40% |
| Miami | 1.82 | $167,000 | $285,000 | 2.9% | 71% | -3% |
| San Antonio | 1.70 | $118,269 | $187,000 | 3.0% | 58% | 59% |
| Manhattan | 1.62 | $1,025,000 | $1,445,000 | -4.6% | 41% | 29% |
| Philadelphia | 1.56 | $110,000 | $140,000 | 8.9% | 27% | 47% |
| Las Vegas | 1.47 | $125,000 | $235,000 | 14.6% | 88% | 1% |
| Bronx | 1.43 | $299,000 | $390,000 | 9.9% | 30% | 43% |
| Phoenix | 1.37 | $120,000 | $219,000 | 9.5% | 83% | 4% |
| Dallas | 1.33 | $82,364 | $284,619 | 5.0% | 246% | 183% |
| San Diego | 1.31 | $360,000 | $545,000 | 9.0% | 51% | 37% |
| Denver | 1.06 | $200,000 | $345,000 | 9.5% | 73% | 104% |
| Minneapolis | 1.06 | $161,415 | $225,000 | 4.0% | 39% | 20% |
| Austin | 1.03 | $168,632 | $361,000 | 5.9% | 114% | 134% |
| San Jose | 1.02 | $500,000 | $942,000 | 23.9% | 88% | 57% |
| Atlanta | 0.95 | $130,000 | $220,000 | 0.0% | 69% | 50% |
| Orlando | 0.94 | $105,048 | $204,500 | 10.6% | 95% | -5% |
| Indianapolis | 0.93 | $112,367 | $129,957 | -6.4% | 16% | 35% |
| Saint Louis | 0.93 | $95,000 | $143,000 | 8.7% | 51% | 43% |
| Tucson | 0.89 | $145,000 | $190,000 | 8.6% | 31% | -8% |
| Seattle | 0.89 | $336,000 | $585,000 | 16.6% | 74% | 50% |
| Portland | 0.88 | $245,000 | $382,000 | 6.1% | 56% | 35% |
| Jacksonville | 0.88 | $95,000 | $152,950 | 2.0% | 61% | 4% |
| Fort Worth | 0.86 | $94,212 | $182,000 | 8.3% | 93% | 70% |
| Charlotte | 0.85 | $140,000 | $200,000 | 8.1% | 43% | 38% |
| San Francisco | 0.84 | $780,000 | $1,265,000 | 7.2% | 62% | 58% |
| Milwaukee | 0.82 | $85,000 | $107,500 | 1.5% | 26% | -9% |
| Columbus | 0.81 | $90,900 | $138,000 | 4.0% | 52% | 51% |
| Fort Lauderdale | 0.81 | $124,900 | $232,200 | 8.8% | 86% | 4% |
| Cincinnati | 0.80 | $87,000 | $133,100 | 4.8% | 53% | 28% |
| El Paso | 0.78 | $125,930 | $133,140 | -7.5% | 6% | 11% |
| Sacramento | 0.78 | $149,000 | $290,050 | 9.5% | 95% | 41% |
| Tampa | 0.76 | $100,000 | $185,000 | 7.2% | 85% | 6% |
| Cleveland | 0.76 | $65,000 | $90,000 | 7.8% | 38% | 50% |
| Saint Paul | 0.75 | $160,000 | $224,125 | 7.0% | 40% | 17% |
| Louisville | 0.75 | $91,600 | $150,000 | 2.0% | 64% | 30% |
| Memphis | 0.70 | $60,520 | $95,000 | 8.6% | 57% | 48% |
| Pittsburgh | 0.69 | $110,000 | $150,000 | 6.0% | 36% | 67% |
| Oklahoma City | 0.67 | $87,500 | $117,000 | -1.7% | 34% | 37% |
| Albuquerque | 0.65 | $168,353 | $198,000 | 1.5% | 18% | 26% |
| Detroit | 0.65 | $17,500 | $30,000 | 25.0% | 71% | 36% |
| Washington | 0.65 | $429,000 | $520,000 | -1.0% | 21% | 37% |
| Baltimore | 0.64 | $86,750 | $95,100 | -3.0% | 10% | -21% |
| Salt Lake City | 0.61 | $168,589 | $261,728 | 10.4% | 55% | 43% |
| Fresno | 0.59 | $139,000 | $224,000 | 4.2% | 61% | 5% |
| Buffalo | 0.56 | $103,000 | $130,000 | 11.5% | 26% | 53% |
| Richmond | 0.56 | $156,500 | $190,850 | 2.3% | 22% | 4% |
| Kansas City | 0.56 | $125,285 | $163,000 | 6.5% | 30% | 38% |
| Colorado Springs | 0.56 | $175,000 | $255,000 | 10.9% | 46% | 40% |
| Bakersfield | 0.54 | $140,000 | $215,000 | 3.4% | 54% | 1% |
| Omaha | 0.54 | $125,000 | $159,000 | 9.7% | 27% | 28% |
| Raleigh | 0.52 | $186,726 | $235,000 | 11.9% | 26% | 34% |
| Mesa | 0.50 | $140,983 | $220,000 | 5.6% | 56% | 10% |
| Birmingham | 0.50 | $255,710 | $174,000 | 18.0% | -32% | -38% |
| Dayton | 0.48 | $76,000 | $109,000 | 2.8% | 43% | 38% |
| Long Beach | 0.48 | $320,000 | $510,000 | 5.2% | 59% | 19% |
| Rochester | 0.48 | $95,000 | $114,000 | 8.7% | 20% | 66% |
| Hollywood | 0.48 | $140,500 | $255,000 | 8.5% | 81% | 2% |
| Staten Island | 0.47 | $360,000 | $479,000 | 6.0% | 33% | 24% |
| Virginia Beach | 0.45 | $225,000 | $240,000 | -0.2% | 7% | 5% |
| Pompano Beach | 0.45 | $107,000 | $210,000 | 8.8% | 96% | -5% |
| Nashville | 0.44 | $165,113 | $275,000 | 10.0% | 67% | 77% |
| Riverside | 0.44 | $220,000 | $399,000 | 12.4% | 81% | 30% |
| Tulsa | 0.42 | $119,000 | $125,000 | 5.5% | 5% | 30% |
| New Orleans | 0.42 | $135,000 | $200,000 | 3.4% | 48% | 111% |
| Wichita | 0.41 | $107,907 | $123,500 | -9.1% | 14% | 35% |
| Honolulu | 0.41 | $419,500 | $507,000 | -3.0% | 21% | 45% |
| Aurora | 0.41 | $171,000 | $306,000 | 9.3% | 79% | 110% |
| Boston | 0.41 | $447,000 | $670,000 | 21.6% | 50% | 74% |
| Knoxville | 0.40 | $141,500 | $168,000 | 6.7% | 19% | 24% |
| Oakland | 0.40 | $290,000 | $660,000 | 9.1% | 128% | 50% |
| Arlington | 0.38 | $99,282 | $193,000 | 10.3% | 94% | 62% |
| Baton Rouge | 0.38 | $146,000 | $169,617 | 17.4% | 16% | 9% |
| Stockton | 0.37 | $130,000 | $250,000 | 6.8% | 92% | 19% |
| Hialeah | 0.36 | $115,000 | $237,500 | 8.6% | 107% | -10% |
| Anaheim | 0.36 | $365,000 | $545,000 | 4.8% | 49% | 31% |
| Grand Rapids | 0.36 | $91,600 | $149,900 | 7.1% | 64% | 55% |
| Santa Ana | 0.36 | $325,000 | $525,000 | 12.4% | 62% | 32% |
| Spring | 0.35 | $139,991 | $227,000 | 6.1% | 62% | 69% |
| Spokane | 0.35 | $145,000 | $184,900 | 8.6% | 28% | 19% |
| West Palm Beach | 0.35 | $93,000 | $200,000 | 8.7% | 115% | 3% |
| Saint Petersburg | 0.35 | $96,850 | $185,000 | 11.3% | 91% | 14% |
| Alexandria | 0.34 | $400,550 | $444,000 | 2.3% | 11% | 14% |
| Columbia | 0.34 | $99,900 | $129,000 | 3.2% | 29% | 3% |
| Littleton | 0.34 | $265,001 | $408,000 | 6.7% | 54% | 56% |
| Tacoma | 0.33 | $155,000 | $262,250 | 9.7% | 69% | 15% |
| Corpus Christi | 0.32 | $107,485 | $176,000 | 4.1% | 64% | 60% |
| Greensboro | 0.32 | $119,000 | $141,000 | 8.5% | 18% | 13% |
| Marietta | 0.31 | $162,750 | $248,000 | 9.3% | 52% | 49% |
| Vancouver | 0.31 | $180,000 | $302,300 | 12.0% | 68% | 30% |
| Toledo | 0.31 | $49,500 | $69,000 | -1.4% | 39% | 10% |
| Fort Wayne | 0.31 | $96,346 | $83,500 | -19.0% | -13% | -4% |
| Lexington | 0.31 | $150,000 | $174,000 | 3.9% | 16% | 26% |
| Silver Spring | 0.30 | $321,000 | $370,000 | 1.4% | 15% | -3% |
| Plano | 0.30 | $170,774 | $331,000 | 5.8% | 94% | 129% |
| Katy | 0.29 | $137,527 | $224,000 | -1.5% | 63% | 81% |
| Naples | 0.29 | $192,000 | $295,000 | 1.1% | 54% | -6% |
| Glendale | 0.29 | $130,000 | $219,000 | 11.6% | 68% | 4% |
| US | $154,000 | $226,065 | 9.7% | 47% | 26% |