Wolf Richter wolfstreet.com, http://www.amazon.com/author/wolfrichter
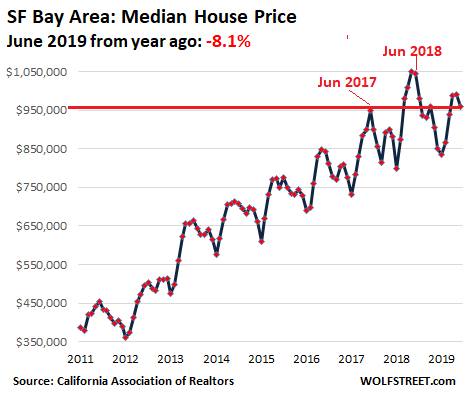
For the 9 counties, the median price in June dropped back to June 2017 levels.
Today we got the final numbers from the California Association of Realtors(CAR) about the status of the housing bubble in the nine-county San Francisco Bay Area, which includes some of the most expensive sub-markets in the US, such as the most expensive zip code in the US, plus the Wine Country (Napa and Sonoma), Silicon Valley (Santa Clara and San Mateo), San Francisco itself, beautiful Marin just across the Golden Gate Bridge from San Francisco, the East Bay (Alameda and Contra Costa), and Solano County, toward Sacramento.
In eight of these nine counties, house prices fell in June compared to June last year. June is around the seasonal peak in terms of prices, but by Bay Area standards, it just wasn’t very peaky. The median price of house sales that closed in June dropped 8.1% compared to June last year, which put it back on the same level as June two years ago:
Sales volume of houses in the SF Bay Area fell 9% in June compared to a year ago. If June was the seasonal peak in prices, the housing market might face an iffy summer and winter as potential sellers are apparently running out of willing and able buyers at these prices.
Sales volume of condos fell 16% in June compared to last year. And condo prices fell 3%.
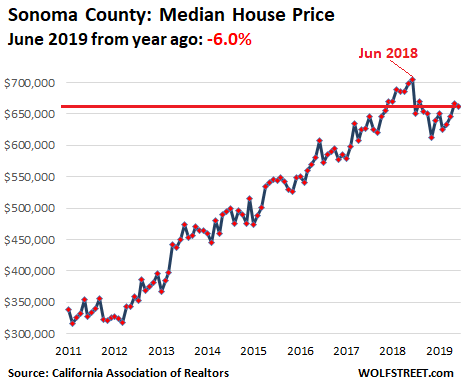
The Wine Country first, to get us in the mood.
Last summer I stuck my neck out to describe the end of the housing bubble in Sonoma County in practically real time, and it has progressed nicely. In June, the median house price fell 6% year-over-year to $662,500:
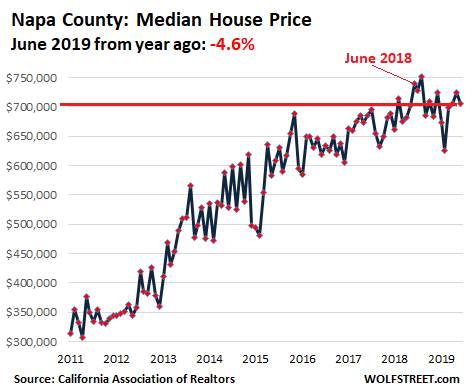
In Napa County, the median house price fell 4.6% year-over-year to $705,750:
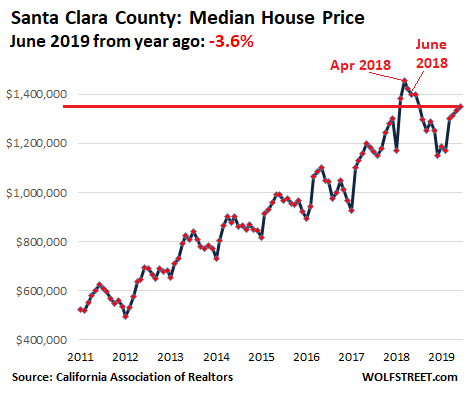
Silicon Valley next, because…
This is where house prices were going to explode because all the IPO billionaires and millionaires from Uber, Lyft, and a bunch of other companies would be suddenly buying homes, a time-honored real-estate hype theory that had been proven wrong before. And the results from those IPO billionaires and millionaires are trickling in.
In Santa Clara county, the southern part of Silicon Valley and the most populous county of the Bay Area, the median house price in June fell 3.6% year-over-year, to $1.35 million, and is down 7.2% from the peak in April last year:
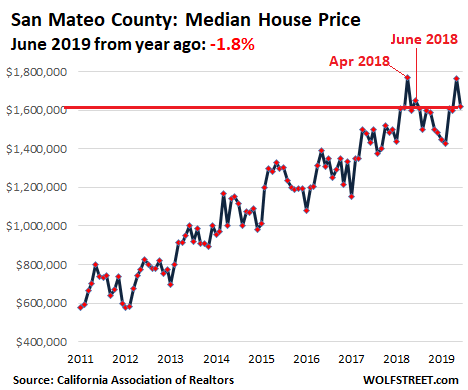
In San Mateo County, the northern part of Silicon Valley, the median house price in June declined 1.8% year-over-year, to $1.62 million. This price is on par with February 2018, and is down 8.5% from the peak in April 2018:
San Francisco
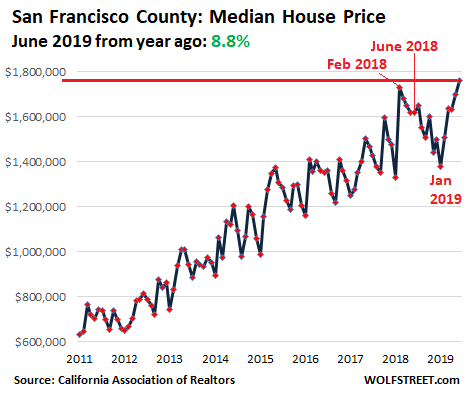
Back in February 2018, house price in San Francisco went on a one-month nutter, jumping without rhyme or reason $400,000 from January to February, or by 30% just in one month, to a fabulous $1.73 million. Then the median price spent the next 11 months climbing down, dropping by $354,000 in the process, to $1.376 million by January 2019.
Then spring buying season kicked in, and in June, the median price reached $1.76 million, up 8.8% from June last year, but up only 1.7% from the prior record in February 2018. This was the only county of the nine Bay Area counties with a year-over-year price gain. And, well, sales volume in June plunged 21% year-over-year.
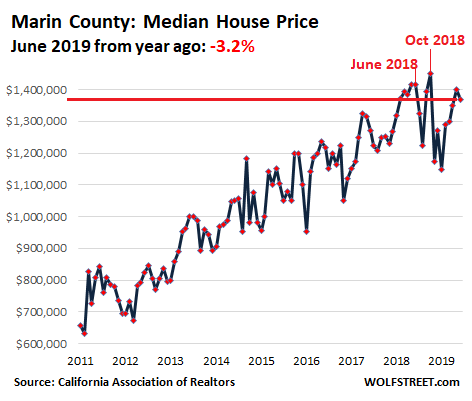
Marin County is famous for Sausalito, Mount Tam, National Monument Muir Woods, and its Pacific Coast among other places. So it’s not exactly a focal point of modern industry and it doesn’t have a lot of high-paying jobs. But it’s only a bridge or a gorgeous ferry-ride away from San Francisco, and so it serves as bedroom community for San Francisco and other parts of the Bay Area and ranks among the most expensive places in the Bay Area. The median house price in June fell 3.2% to $1.37 million. This is on par with February 2018 and down 5.5% from the peak last October:
The East Bay
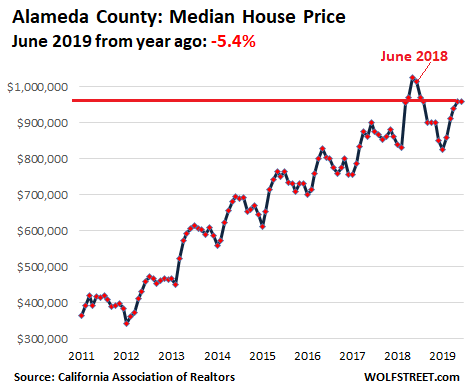
In Alameda County – where Oakland and Berkeley are – the median house price in June dropped 5.4% year-over-year to $960,000 and is down 6.3% from the peak in May 2018:
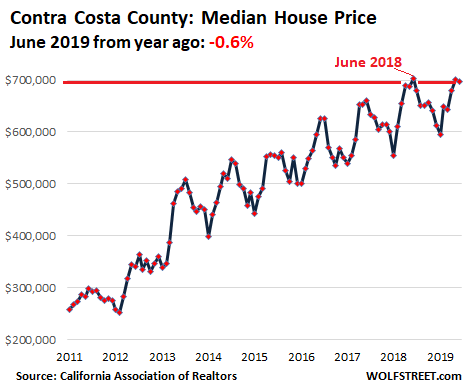
In Contra Costa County, the median home price in June ticked down 0.6% year-over-year to $698,000,
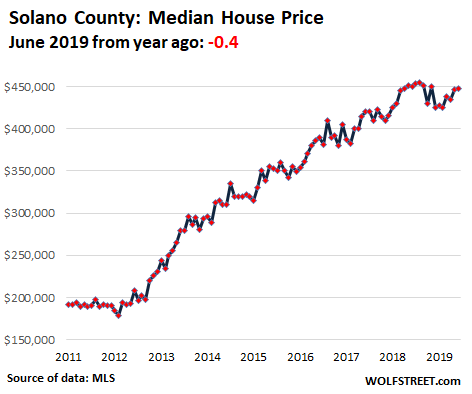
In Solano County, the median home price in June ticked down 0.4% year-over-year, to $448,000 and is down 1.6% from the peak in August 2018:
For the nine-county Bay Area, the year-over-year decline of 8.1% is the steepest decline since November 2011, during the trough of Housing Bust 1. December last year was the first month with year-over-year declines of any kind since March 2012. During the headiest days of Housing Bubble 2, year-over-year price increases of 20% were not uncommon and maxed out at 38% in May 2013. So this situation is not a sudden collapse or anything, but clearly, the Bay Area’s Housing Bubble 2 has lost its mojo.