
Interestingly, you’re about to find out that the fall in housing prices and home sales may power us further into high inflation for longer. We are entering a situation that could turn into a true oxymoron where lower prices equal higher prices as early as this week at the Fed’s Federal Open Market Committee meeting. I’ll tell you how that works.
Housing prices are finally falling
First the good news if you are home buyer who has been sidelined.
Sales of new single-family homes continue to fall, taking another 6.6 percent drop in June to 676,000 new homes sold (seasonally-adjusted) from 724,000 in May. Sales are down 19.4% year-on-year, which is considerable when you consider that the market was barely warming up from the COVIDcrash last June. However, sales are still 31.9% below the pre-COVIDcrash pace of 993,000 in January, 2020, which was the peak of Housing Bubble 2.0. Sales are now roughly back to the 677,000 level from August 2019. The only region where sales rose was the Midwest.
Higher housing prices are definitely putting off buyers as may be slightly rising mortgage rates. Housing shoppers, after all, buy payments, not typically total price of a home. Inventory has been a factor in declining sales, but right now sales are down while inventory is way up:
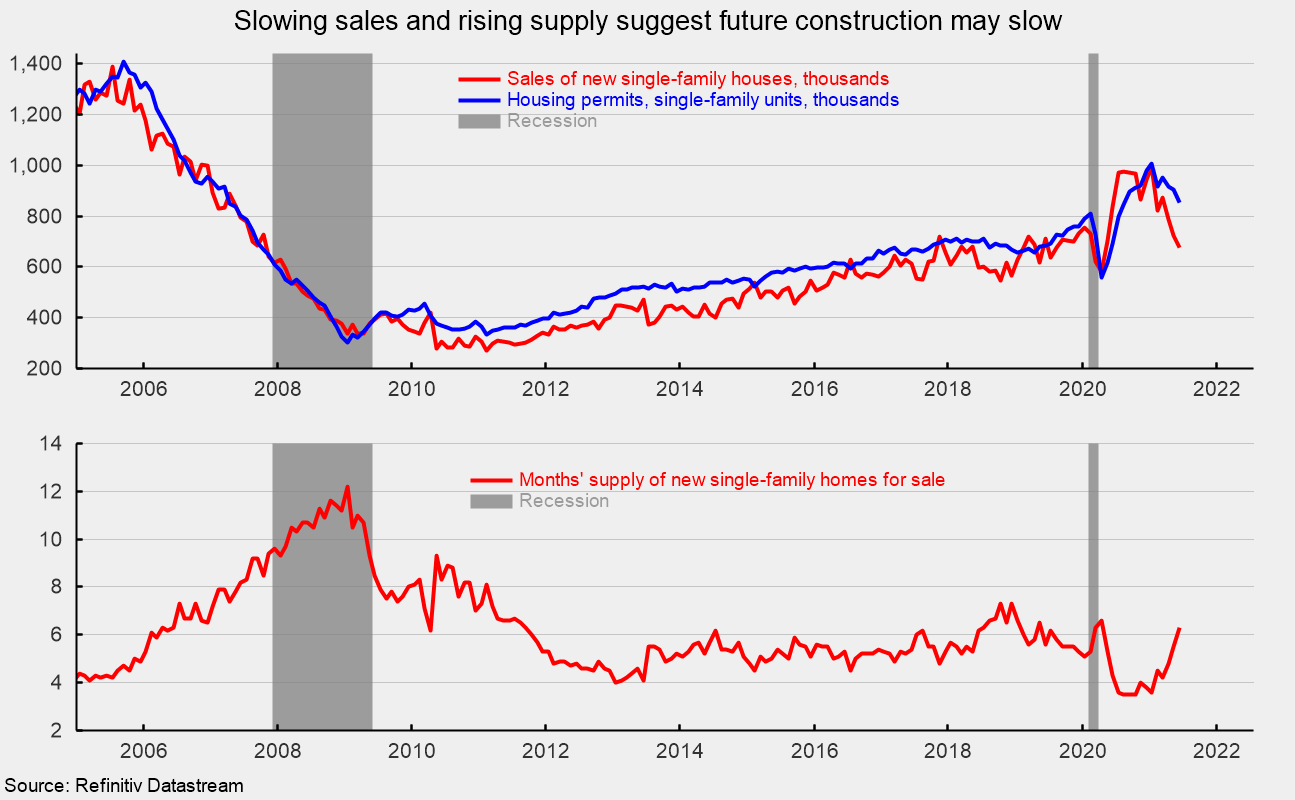
It’s important to bear in mind, though, that housing inventory is generally tracked (as seen here) by how many months of supply the market holds, which is a measure of the number of houses currently on the market times twelve divided by the number of houses that have sold in the past twelve months. Therefore, “inventory” can rise even if the total number of houses on the market remains stagnant or falls if the number of sales for the year is falling faster. Generally, because the numbers used are annualized, that is not likely to be a big factor. However, in a volatile market with minuscule inventory and a small volume of sales compared to other years, it is is a little hard to say what is driving inventory up in this picture — a sudden, large increase in available houses for sale or the current plunge in the rate of sales, making it so that the few homes out there will stay on the market longer.
Prices, as you can see below, have just joined sales in taking their a drop, but the averaged trend line is still rising, and the amount of the drop is within the normal ups and downs along the rising trend. They’ve dropped like this before and then bounced up higher the very next month. The question is will they fall again in the current month and, therefore, break the trend or rise back up and just turn out to be a normal bounce along the rising trend:
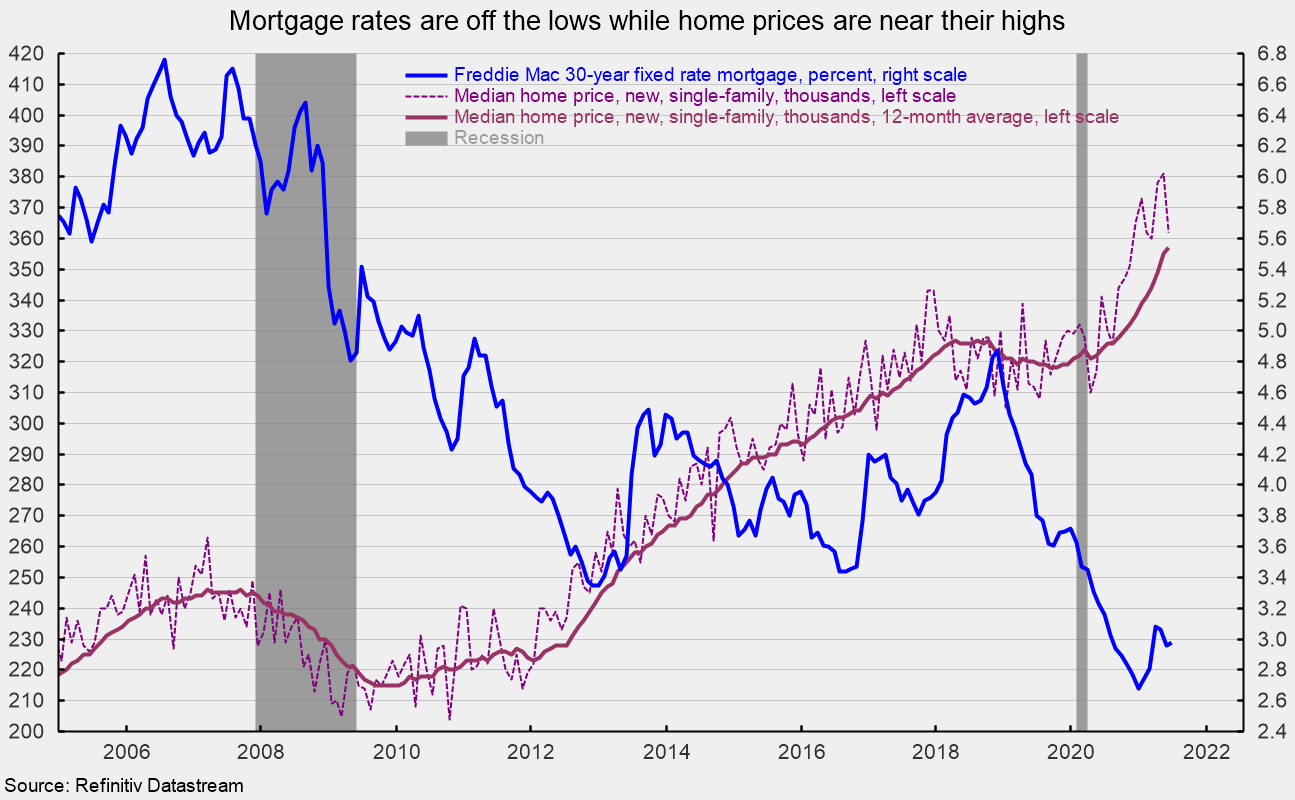
At the same time, mortgage rates, as you can see have been climbing, which could account for the fall-off in housing prices. For more granular detail, I recommend the following article that is the source of these graphs: “New Single-Family Home Sales Fell Again in June.”
The 32% plunge since January, 2020, may represent more than a buyer’s strike. It certainly includes a buyer’s strike due to extreme prices, but I think something more is going on here. I believe we may be seeing the inevitable erasure of the all-out nonsense that happened in the market post-COVID. Sales (not so much prices yet) have fallen hard mostly because their rise was such an abnormality in the first place. An abnormality of that magnitude was highly like to purge itself. So, the present drop is clearing away a COVID artifact.
You can see that best in the graph below. As I noted above, sales of new single-family houses have fallen back below where they were when COVID hit clear back to where they were in 2018 and early 2019. I think that reflects a combination of the removal of the abnormality plus the impact of extremely high prices. The following graph by Wolf Richter shows the abnormality a little more clearly than the above graphs:
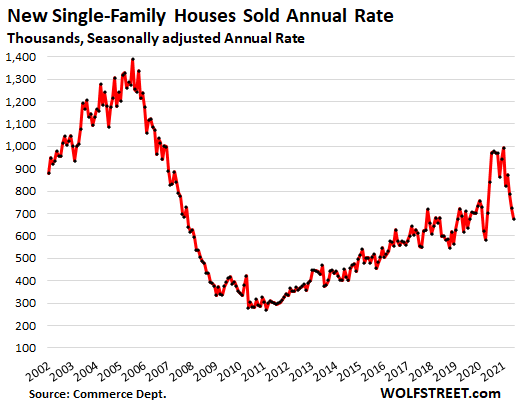
We’re actually now below the former longterm trend in home sales. Richter’s graph shows that we took a small fall in housing sales during the initial COVID lockdowns, then overshot in an historically huge bounce back up that looks a gross overreaction, and we have now dropped back to what looks like a market suffering a COVID hangover. That is for housing sales. The question that remains is how long it will take for the nonsense to get fully pounded out of housing prices or whether it even will.
Drops in pricing always lag drops in sales, usually by about half a year. In the present case, they have just started falling about four months into declining sales. Everything is more volatile it seems with COVID.
Obviously Housing Bubble 2.0 never even came close to hitting the number of sales in Housing Bubble 1.0; and, yet, housing prices, exceeded the highest prices of the original housing bubble. It’s interesting that housing prices (see below) have run so high with sales (seen above) always far below the original housing crisis peak. Compare where housing prices are now to the peak they reached just before the Great Recession:
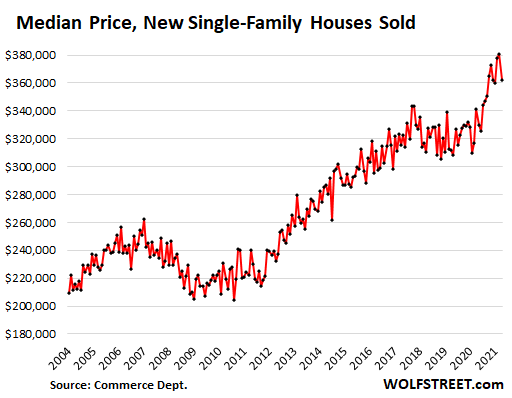
We’re on Mount Everest.
Housing prices will continue to contribute to CPI inflation
Since prices lag sales, housing prices may stay up in the stratosphere shown in Wolf’s graph much longer than sales do. Now, here is the first key to understanding the oxymoron: In terms of their contribution to inflation, where they are a major component of CPI, one needs to understand how much slower than the real market housing prices are to factor into CPI. Due to how CPI is calculated, the rise that has already happened hasn’t even been price in yet. We’ve seen what change there has been in rents price in, but very little from the prices of homes sold. The impact on CPI from the rise in housing prices will continue for many months to play through CPI. The following explains why that is:
Higher housing prices have to become higher rent prices in order to show up in CPI because CPI measures even the prices of homes sold in terms of comparative rental values. Only after rents rise, will the homeowners who, via a survey, provide the only housing-cost metric CPI tracks outside of rent catch on to how much rents have risen so that they have a modicum of a notion about how much their house is actually worth AS RENT.
You see, the BLS determines housing prices by asking ordinary homeowners, “How much would your house rent for?” CPI’s housing price index is made up of rent prices and housing sale prices, but the latter are calculated based on a guess of rental equivalency, which is entirely ludicrous because it should be determined based on something like how much new buyers’ payments have risen, averaged over the number of total homeowners, including whose payments have not gone up because they haven’t bought a home in the past year. (CPI used to base the homeowner part of housing prices on real costs of home ownership, not rental equivalency.)
Right now, the way CPI measures housing costs presents a huge abnormality of its own: Moratoriums on renter evictions have artificially frozen rents, BUT moratoriums on the evictions of homeowners have actually raised prices by limiting inventory because prices were not frozen in the mortgage moratoriums, but foreclosures were so not as many houses entered the market, which has a rising effect on home prices. What happens when those moratoriums terminate at the end of this month? Then rents likely leap up. That will raise the rental component of CPI, but it will take homeowners, who do not pay rents, awhile to become aware of how much rents have risen in order to have any realistic idea when surveyed as to what their house would rent for. In other words, the Bureau of Lying Statistics asks the least-informed people on the planet to guess what their house would rent for because they don’t rent, and that becomes the price component for home ownership in the Consumer Price Index.
The means there is a lot of inflation of housing prices already loaded in the system that is ready to explode the CPI figures when forbearance fully ends all of which still has to play through. Expect, therefore, to see CPI rise for MONTHS to come! It may rise for as much as a year as rents now seriously reprice upward after forbearance. What a mess that could turn out to be BECAUSE rents need to reprice all the way up to align with the much higher mortgages landlords are paying to buy those rentals. Oh, and then rents have to cover property taxes, and property taxes can take up to a year for assessments to catch up to what has happened in housing prices. Rents also have to price in inflated maintenance costs. So, when that portion of the rental market that has been locked up in forbearance finally is freed, it’s going to be like knocking a hole in an earthen dam! Housing costs are about 30% of CPI.
Meanwhile, as I said in a recent article, lumber prices and other building materials are not going to give new home prices much room to fall. Lumber fell briefly from its absurd peak of about $1,000 per thousand board feet, but then leveled off and has now risen back to well over $600 per thousand board feet, which is still 60% higher than a year ago. Most material costs, appliance costs, and labor involved in building a home are substantially higher than a year ago and are still rising. So, there is a whole flood of background price increases that have yet to push through to where they show up in the housing component of CPI.
The following graph reflects the annual rate of rise in construction costs, not the total cost of materials, but you can see the costs involved in home construction are still rising faster than they have since the high inflation summit of the late seventies and early eighties:
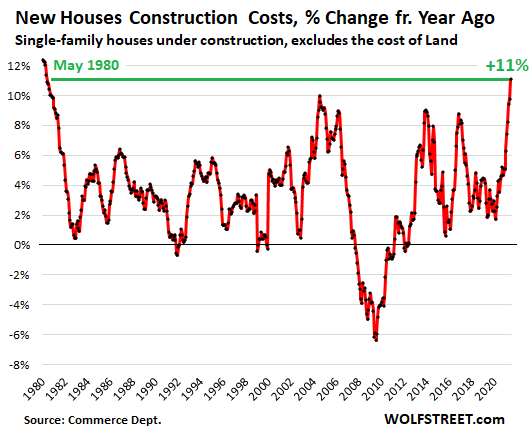
As I’ve said would happen, we are already back in the inflation of the seventies, and the government numbers still have a lot of catching up to do!
You can check out Wolf’s article for more detail here.
The impact of housing prices on the Fed
Pressure from average citizens who cannot begin to afford all of this inflation in their home prices and their rents will go off the charts. That will be when Powell wakes up to realize how much inflation was not showing up on the Fed’s gauges that he actually needs to deal with. The resulting Fed effort, pressured by the public, to curtail that suddenly inflationary spike will have to be large and rapid. The resulting Everything Crash is likely to be monumental.
Renters will have no choice but to absorb these high costs because they are already priced in for landlords on the mortgage side, and those much higher home valuations will also be priced in to property taxes over the next year, which rent has to cover. So, renters have not yet begun to experience the real rental disaster that is in the making. They will start to at the end of this month if the government doesn’t once again maintain the forbearance dike that effectively protects rent rates by telling landlords they cannot evict if renters don’t agree to pay much higher rents.
When forbearance ends, the impact of the pressure on rents from costs that have already flooded the land but have been artificially diked off from renters will be massive once the artificial dike comes down. The impact on CPI will play out over a year even if prices of homes don’t rise at all from this point because the facts are already on the ground. Renters will have to absorb them or be endlessly bailed out by the government. The masses will likely revolt.
That’s all a little gift from Father Fed to you. If you’re not in the half-a-million-or-above range for the kind of home you can afford, the Fed’s plan has forced you to remain a renter for life. The good news is that the Fed’s last bubble crashed and allowed first-time buyers to enter the market again, and this one now looks like it could be topping out. It won’t help CPI numbers (unless those numbers are, as would not seem unlikely, highly massaged in the months ahead to remove the problems above as “seasonal adjustments,” never mind that they have nothing to do with seasonality). You can expect the government to do its best to keep this high inflation that is hitting your pocket books out of the official numbers in order to quell the citizen’s revolt. While it may be hard mathematically to pull that off in a justifiable way, they have the home-team advantage of financial media that seem more than ready to be spoon-fed by the government and the Fed and never question their pablum.
The impact of collapsing housing market on Fed stimulus
Now, here’s an interesting little twist for you — the oxymoron: While housing prices are likely to put upward pressure on CPI inflation for as much as a year, the fall in housing prices is also likely to put upward pressure on long-term inflation. O.K., that’s bizarre to the point of sounding nonsensical. If you think so, my first thought is to agree, but hear me out.
Remember I said the key was in understanding how slowly existing cost increases and home price increases play through the CPI index.
In previewing Wednesday’s FOMC meeting, [Deutche Bank’s] Jim Reid pointed out that the bank’s economists are generally expecting the Fed to provide an update on the progress of taper discussions that will help refine the likely timeline for an announcement in the coming months….
Speculation is rife that that key debate topping the FOMC agenda on Wednesday is whether to taper the Fed’s purchases of mortgage-backed securities faster than its buying of Treasury debt. As Bloomberg wrote on Sunday, “policy hawks at the Federal Reserve are setting their sights on scaling back the U.S. central bank’s massive intervention in the mortgage market as home prices soar. But the Fed leadership doesn’t sound convinced by arguments in favor of a hasty exit strategy.”
What will be the Fed’s big concern now that housing prices have started to slide a little? How about bank’s losing the value of collateral? How about gut-level fears that remain from the last time housing prices took a turn at the top of a much smaller price bubble back in 2007?
The prices look to be turning down, and they inflation in housing prices hasn’t even really hit CPI yet, so the Fed is likely to think this is it; the turn is in. They will see the housing market is at a possible tipping point, just as the Fed is finally starting to think about when to think about tapering.
Meanwhile, the Fed has, as I wrote a month ago, already begun a little clandestine tapering in mortgage backed securities. Yes, MBS, the solar plexus where the last housing crash bashed the United State’s financial system in the gut. Do you think they might just be a little shy about backing off on their housing market stimulus right as prices start to tip? One of the reasons mortgage rates have started to rise a little is that the Fed is already rolling MBS off of its balance sheet, which lifts mortgage rates, and it was the rising of mortgage interest rates that triggered the last landslide in overpriced housing.
So, the sudden, and to many unexpected, wavering in the housing market — sales and prices — could be all it takes to spook the Fed to press its foot down on the accelerator a little longer — to see how that waver in prices plays out before cutting back inflation-causing stimulus any harder.
As I’ve been saying, the Fed is now stuck in a place where it is damned if does and damned if it doesn’t because inflation is at its back, and it can’t slow inflation without crashing an economy it has made dependent upon its stimulus. Without Fed fuel, this economy doesn’t fly; but, if the economy does fly, inflation flies along with it now that it has finally begun and now that the federal government is pumping a lot of the Fed’s free money into consumer hands.
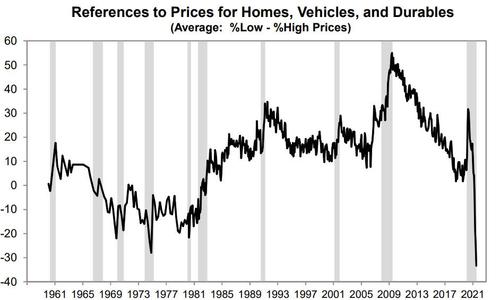
You see, as ZH points out, the University of Michigan’s consumer sentiment survey shows that consumers have never complained more about rising housing prices:
However, what buyers are really concerned about is rising house payments. So, let mortgage rates rise a little more by backing off of those MBS purchases that are designed to suppress mortgage rates, and already fatigued buyers will fall away even faster than they did in June.
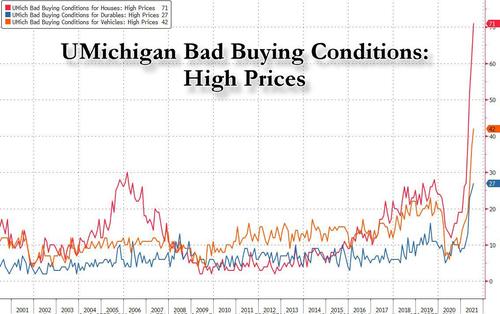
Here is how UMich compares buying conditions, which include mortgage interest, for homes (red line) compared to conditions for buying also very overprice vehicles and other durable goods:
All this means the dip in the housing market could press the Fed’s back to the wall if it is thinking about raising interest rates on homes by backing off on its easing. Bloomberg notes that falling housing prices are
… adding to the case that the housing market may have peaked, potentially furthering expectations for slowing inflation across the board.
To many minds that is the case, but the many are not looking at how inflation from high housing prices will continue to slowly play through in the CPI headline inflation rate as I explained above, regardless of the recent price drop in the market. If the Fed feels inflation is backing off, it will believe it has more room to keep its foot on the accelerator, which is where it wants its foot. That, in turn, means the Fed has more likelihood of going too far when it has already gone too far but just can’t see it because it’s not showing up on the Fed’s gauges … yet.
If you think the Fed is not that blind, just remember how the Fed failed to sense its back was up against the wall as it continued tightening into the very repo crisis. I predicted at the start of 2019 we’d likely see the Fed reduce bank reserves so far via its continued tightening that the Fed would create a massive repo crisis in the latter half of that year that would force it back to full-on QE. The Fed is now likely just as blind and will think the fall in housing prices means 1) inflation is already retreating, 2) it had better not back off on stimulus too quickly now that prices are already turning a corner or the fall may be hard.
I’m not saying the Fed will levitate prices back up, but it may keep pumping more money into banks via MBS purchases. The Fed may, as ZH put it, be tempted to taper its tapering talk and keep all interest rates lower for longer and will overrun its quantitative easing just as it overran its quantitative tightening in 2019. The Fed has demonstrated it is not the sharpest cheese in the fridge when it comes to metering its moves. Even Ben Bernanke once said the Fed is guilty of crashing just about every expansion it ever created.
What we may see in our present odd scenario of shortages and low production is stagflation where the amount of inflation already built up continues to play through and shortage continue to drive higher prices while the economy crumbles. All we need for that to happen is continued expansion of money supply in the hands of consumers during this time of global shortages.
So what does the Fed do: will it taper just as fears about the US economy resurface, sparking the market shock which Bank of America, Morgan Stanley and even Goldman have been warning about in recent weeks, or will it announce that it is no longer “talking about talking about tapering”?
If it chooses the later, it will keep dumping fuel into the inflationary inferno and power us right into the full heat of the blaze. Maybe we’ll know tomorrow when the Fed comes out of its July FOMC meeting which way it is likely to go — higher inflation for longer or start killing the economy right when housing prices have started to fall.