If you’re like most people, your income and spending changes significantly as you get older.
In the most common career trajectory, earlier years coincide with a lower salary as skills and experience grow. Then, peak earning years are achieved in late adulthood, and eventually retirement comes onto the horizon.
Is this typical earnings arc supported by data?
Income and Spending, by Age
The data visualizations in today’s post come to us from Engaging Data and they use Sankey diagrams to display data from the Bureau of Labor Statistics (BLS) that shows income and expenditure differences between varying age groups in America.
The four charts below will show household data based on the age of the primary resident:
-
- Less than 25 years old (Very early career)
- Between 25-34 years old (Early career)
- Between 45-54 years old (Peak earning and spending)
- More than 75 years old (Retirement)
Let’s take a look at the collection of data, to see how it shakes out.
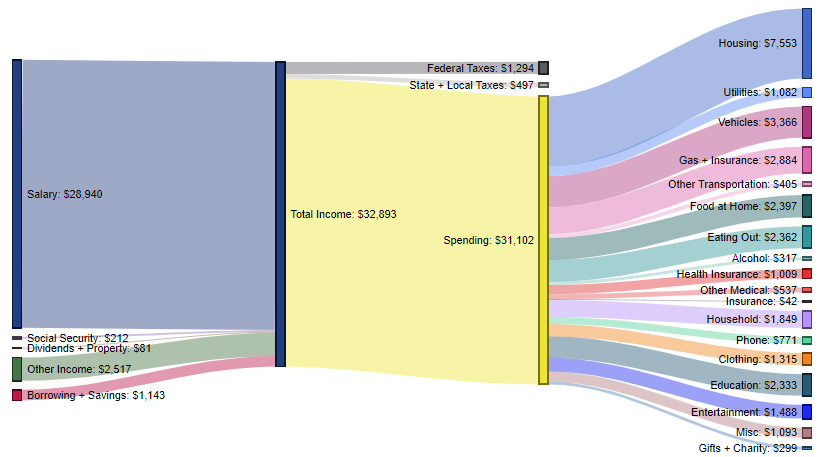
Less than 25 Years Old – $31,102 in spending (94.6%% of total income)
These contain an average of 1.9 people (1.3 income earners, 0.3 children, and 0.0 seniors)

For the average household with a primary resident under 25 years old, total income is $32,893.
The biggest expense is housing (24.3% of spending), followed by vehicles (10.8%), gas and insurance (9.3%), food at home (7.7%), and dining out (7.6%). For this younger cohort, education is also a significant expense at $2,333 per year (7.5% of spending).
Between 25-34 Years – $48,928 in spending (70.8% of total income)
These contain an average of 2.8 people (1.5 income earners, 1.0 children, and 0.0 seniors)

In this age range, earning potential starts to rapidly expand with experience – and households make double that of the previous category (Under 25 years old).
Housing remains the biggest expense (25.9% of spending), followed by gas and insurance (9.2%), household expenses (8.2%), food at home (8.1%), and then vehicles (8.1%).
Between 45-54 Years – $64,781 in spending (64.6% of total income)
These contain an average of 2.8 people (1.7 income earners, 0.7 children, and 0.1 seniors)

This age range is notable because it has both the highest income and the highest spending. It also represents a time of peak savings, with the average household stashing away $19,159 per year.
Expenses are similar to the previous category. Housing is the biggest expense (22.0%), followed by gas and insurance (9.0%), food at home (7.9%), vehicles (7.9%), and household expenses (6.7%).
Over 75 Years Old – $40,211 in spending (95.6% of total income)
These contain an average of 2.6 people (0.2 income earners, 0.0 children, and 1.4 seniors)

Not surprisingly, here we see salary contributing just $7,891 per year to total income, with social security supplementing income with $25,057 per year.
For this older segment, health insurance (8.2%) jumps up to become the second most important expense. Meanwhile, driving and housing both drop in their respective allocations.
The Typical Earning Arc?
The data confirms that conventional wisdom around the typical earning trajectory for Americans seems pretty accurate.
For more breakdowns, check out how Americans spend their money based on income levels or education levels.
Did you find any surprising anomalies in the numbers?