via Zerohedge:
It’s Monday, which means a new dose of gloom has been released by Morgan Stanley’s “prophet of doom”, chief US equity strategist Michael Wilson, who writes this morning that he “sees an increasingly risky environment as deteriorating data and a dovish Fed stand off.”
As a reminder, last Friday we reported that the Morgan Stanley Business Conditions Index just suffered its biggest one month drop in history. Predictably, this was sufficient ammo for Wilson to launch on what may be his most bearish tirade so far this year, and as the strategist writes, “data points and analyst sentiment are falling and we think PMIs and earnings revisions are next.” That’s just the beginning:
Decelerations and disappointments are mounting:
- Cass Freight Index
- Retailer earnings
- Durable goods orders
- Capital spending
- PMIs
- May payrolls
- Semiconductor inventories
- Oil demand
- Restaurant performance indices…
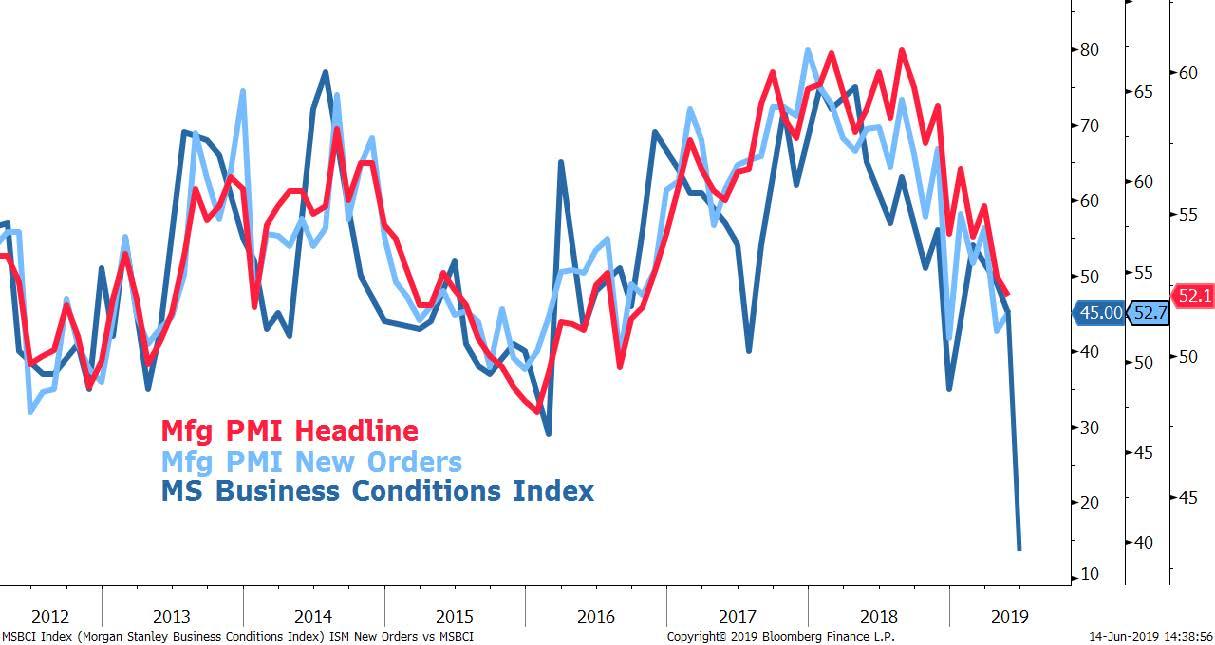
and our own Morgan Stanley Business Conditions Index (MSBCI). Looking at the MSBCI in particular, the headline metric showed the biggest one-month drop in its history going back to 2002 and very close to its lowest absolute reading since December 2008.
This index has a tight relationship with ISM new orders and analyst earnings revisions breadth. Our analysis shows downside risk to ISM new orders (25% y/y), S&P earnings revisions breadth (6-13%) and the S&P 500 y/y (8%) if historical links hold.
While we showed the MS BCI last week, here it is again in the context of PMI Headline and New Orders. As Wilson warns, “be prepared for a sharp fall in PMIs” as the MSBCI suggests the Mfg PMI New Orders component will fall to 40 over the next few months, which would be down approximately 25% on a y/y basis. Another way of putting it – if Morgan Stanley’s indicator is right, the world is already in a recession.

As Wilson explains, the reason he takes this MSBCI so seriously is due to the very tight relationship it has with the ISM Manufacturing purchasing manager index and new orders (shown above) and the ISM’s relationship with y/y changes in the S&P.
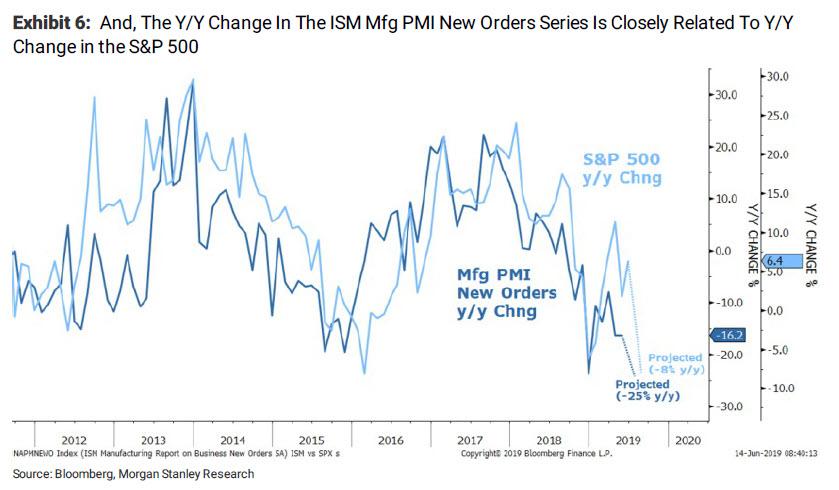
Speaking of the latter, Morgan Stanley cautions that based on the historical relationship between the y/y change in the Mfg PMI New Orders and S&P500, “we now expect a fall of approximately 10% for the major indices with wide dispersion between stocks and sectors.”
As the next chart illustrates, the implied -25% y/y plunge in the Mfg PMI New Orders translates into an 8% decline in the S&P 500. “Assuming this occurs in the next few months, that would give us downside to 2450 at the low end and 2650 on the high end, depending on when and if the PMIs fall and the market prices it. We think 2600-2650 is a good range to think about adding risk broadly”, Wilson writes.
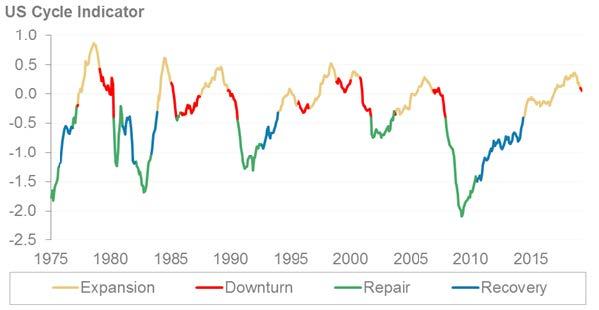
Besides the MSBCI, there are several other indicators that suggest the NBER will soon determine the recession started some time in the first half, starting with Morgan Stanley’s US Cycle indicator, which moved into the “downturn” phase in April (not May).
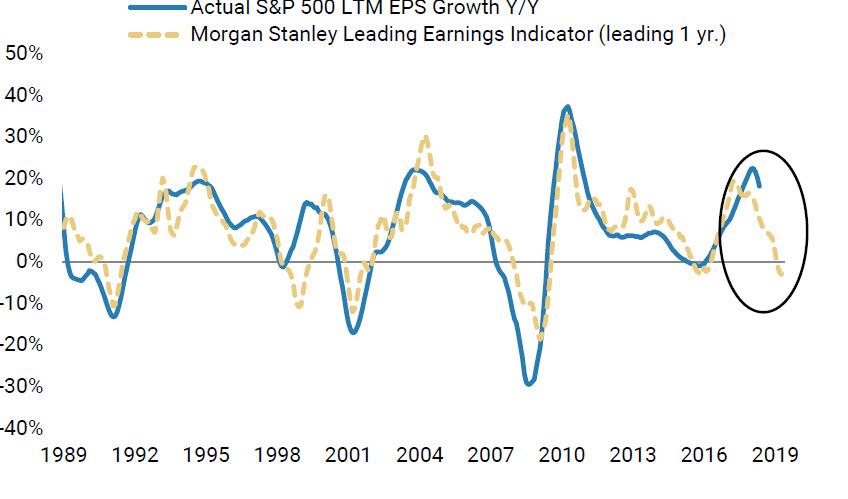
Additionally, the Morgan Stanley Leading Indicator is not only screaming earnings recession with a negative print for the first time in 4 years, but shows no sign of bottoming.
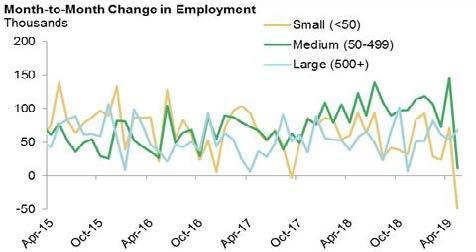
What is more worrysome is that what until recently was the strongest component of the US economy, the labor market, is starting to be hit too, with both small and medium companies posting a sharp drop in employment growth.
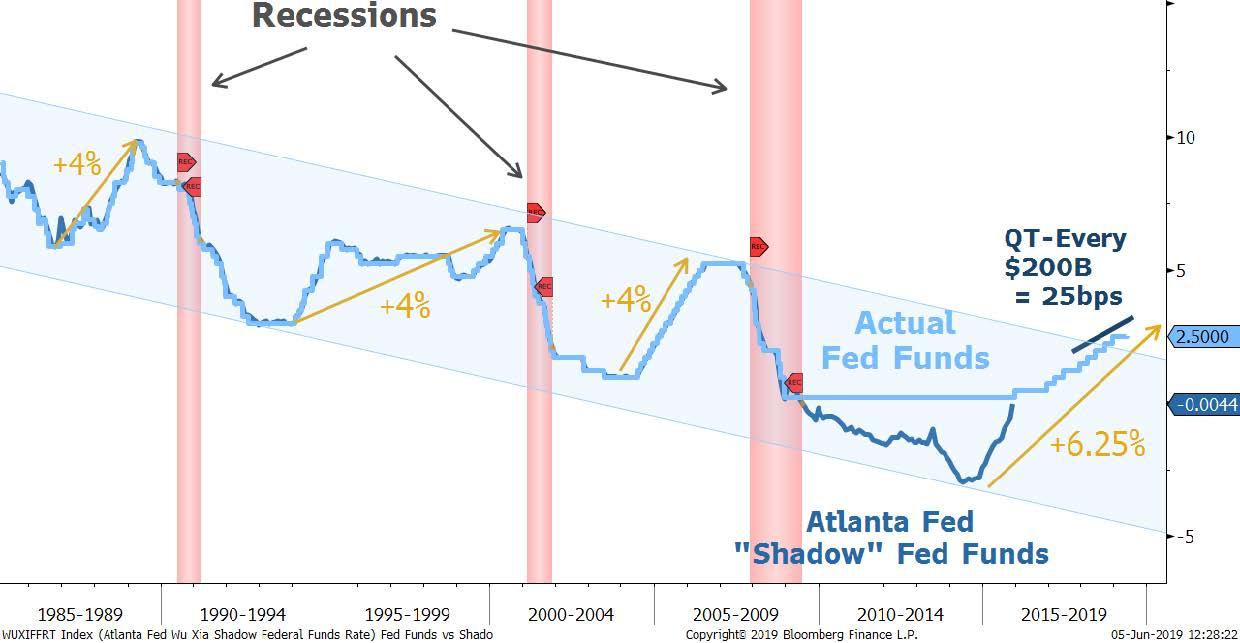
Shifting to markets, Wilson notes that the Fed has tightened “a lot” since 2014, when one accounts for QE and QT. In fact, based on the Atlanta Fed “Shadow” Fed Funds rate, the current tightening cycle has hiked not by 2.25% (or nine times), but by a whopping 6.25%!
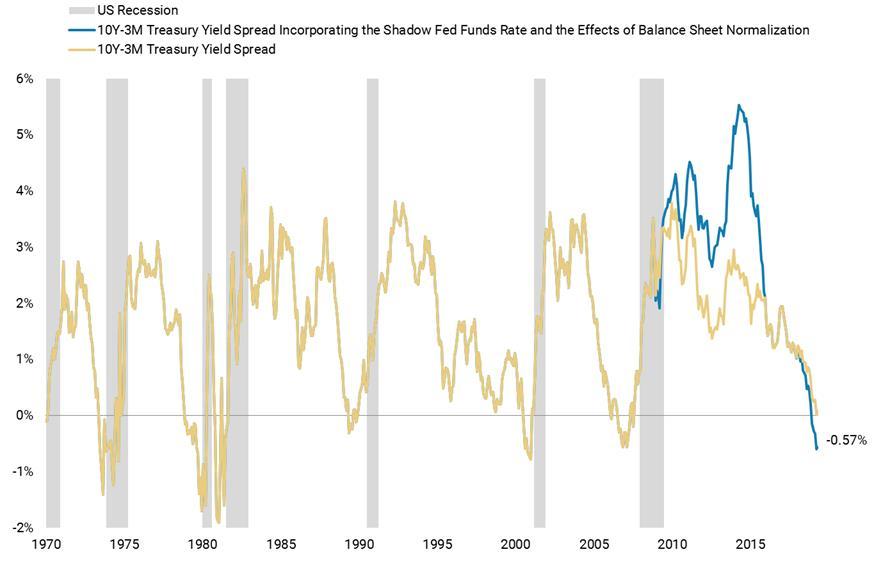
Extending Morgan Stanley’s QE/QT adjustment extrapolation, Wilson repeats what he noted two weeks ago, namely that the 3M/10Y yield curve inverted all the way back in November. And as a reminder, it is the subsequent steepening that crushes markets. The inverted curve has now bottomed.
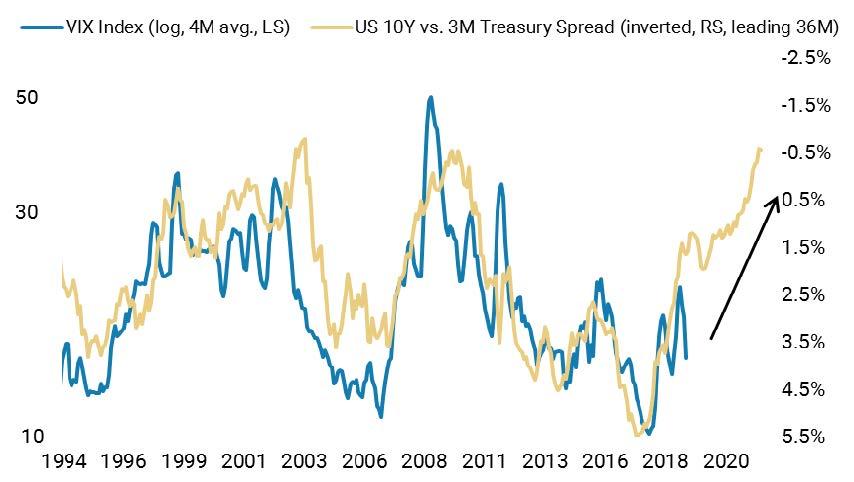
But before that happens, the VIX has to catch up to the 36 Month leading yield curve. As per everyone’s favorite VIX-Yield curve correlation chart, the VIX will peak somewhere around 40 before it start normalizing again.
What to make of all this, besides that a global recession is already here if Morgan Stanley is right? Here are some concluding bullets from Wilson, who explains why the 2018 Cyclical (and Rolling) bear market still has some unfinished business:
- 2019 was mostly about policy support – the Fed + China fiscal – and now the focus is back on trade risks but it could shift towards US recession risk.
- While we think the price lows are in for this cyclical bear market, it’s likely capped and has some unfinished business – i.e., a deeper retracement than most are expecting.
- The policy mistakes were fiscal + tariffs, not monetary – i.e., the Fed can’t ‘fix’ it. The negative knock-on effects of the US earnings recession are underappreciated.
- US companies have a cost/margin issue that isn’t going away. Trade conflict exacerbates these issues and a ‘deal’ doesn’t remove them.
- Despite new highs for many markets in April, the internals never confirmed the view for a big reacceleration in 2H19 or 2020 that many investors were/are counting on.
- We remain defensively positioned with some cyclical upside until valuations get more attractive and/or earnings risk has been removed via lowered estimates.