Consumers that added $1.3 trillion to their savings last year are not the ones who owe $1 trillion on their credit cards.
By Wolf Richter for WOLF STREET.
This phrase, “consumers in aggregate,” is starting to crop up even in Fed speak, including in Jerome Powell’s press conference this week, to express that they’re not totally blind to what is happening. Consumers “in aggregate” – all of them thrown together into one bucket and summarized with one number – are still doing their job, propping up the US economy.
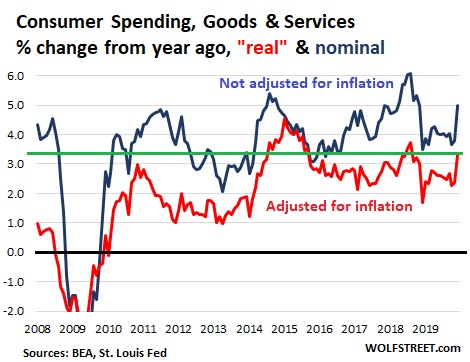
Consumer spending on goods and services, as tracked by the Personal Consumption Expenditures data released this morning, rose 5.0% in December (blue line) compared to a year earlier. For the year 2019, consumer spending on goods and services rose 4.0% to $14.6 trillion, amounting to 69% of GDP. Adjusted for inflation, “real” consumer spending on goods and services (red line) rose 3.3% in December compared to a year earlier. In December, consumers pulled out their wadded-up cash, credit cards, and payments apps and stepped up to the plate:

Consumer spending on services alone rose 4.3% in 2019, to $10.05 trillion. This includes healthcare, tuition, rents, hotel rooms, financial services, haircuts, auto repair services, etc., and accounts for about 69% of consumer spending.
Consumer spending on goods rose 3.3% to $4.51 trillion, accounting for 31% of consumer spending. This includes data that we see elsewhere as retail sales.
And then there’s interest, which is not included in goods and services. Interest payments on mortgages, auto loans, credit cards, and student loans in 2019 rose by 7.4% to $362 billion. This surge in interest payment occurred due to larger mortgage debts and higher consumer loan balances, and despite the plunge in interest rates – except, well, um, on credit card loans and personal loans, where interest rates remain very high.
Total “personal outlays,” which include everything that consumers pay for, from goods and services and interest to sending money overseas ($92 billion in 2019,) rose 4.1% to $15.13 trillion.
So where did consumers get this money?
Personal income from all sources, earned by all consumers combined, rose 3.9% in December from a year ago, and by 4.5% for all of 2019, to $18.6 trillion. Adjusted for inflation, “real” personal income ticked up 2.3%.
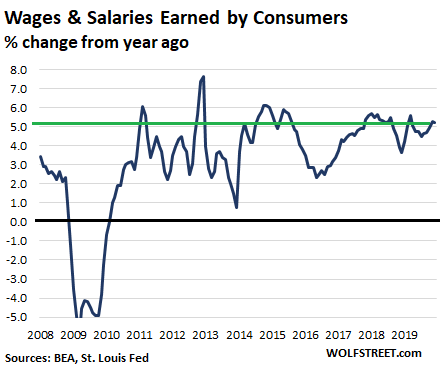
About half of personal income comes from wages and salaries. This is the amount all consumers combined were paid before taxes and other deductions. It’s a function of how many people are working and of what these jobs or side-gigs pay. In December, the total amount consumers received in wages and salaries grew by 5.2% year-over-year. For all of 2019, wages and salaries received grew by 4.9% to $9.32 trillion:
The table below shows the details for personal income by category for 2018 and 2019 and the percent change. Capital gains on investments – which have been hefty in 2019 – are not included. Proprietors’ income and rental income are net of “capital consumption,” which includes depreciation.
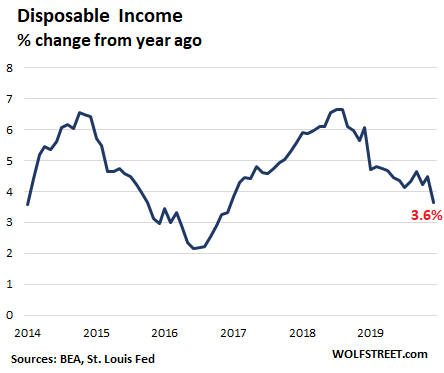
All forms of income combined minus taxes and minus contributions to “government social insurance” (such as Social Security) result in disposable income, the line at the bottom of the table, which grew by 4.4% in 2019 to $16.4 trillion:
| 2018, Billion $ |
2019, Billion $ |
% change | |
| Total Personal income | 17,819 | 18,624 | 4.5% |
| Wages and salaries | 8,889 | 9,323 | 4.9% |
| Goods-producing industries | 1,472 | 1,539 | 4.6% |
| Services-producing industries | 6,014 | 6,332 | 5.3% |
| Government | 1,403 | 1,452 | 3.5% |
| Employer contributions | 2,040 | 2,125 | 4.2% |
| For pension & insurance plans | 1,417 | 1,473 | 4.0% |
| For government social insurance | 623 | 652 | 4.6% |
| Proprietors’ income with inventory valuation and capital consumption adjustments | 1,589 | 1,656 | 4.2% |
| Farm | 27 | 31 | 14.3% |
| Nonfarm | 1,562 | 1,625 | 4.1% |
| Rental income with capital consumption adjustment | 757 | 778 | 2.8% |
| Personal income receipts on assets | 2,930 | 2,993 | 2.1% |
| Personal interest income | 1,703 | 1,721 | 1.0% |
| Personal dividend income | 1,228 | 1,272 | 3.6% |
| Government social benefits to persons | 2,918 | 3,118 | 6.8% |
| Social security | 972 | 1,035 | 6.4% |
| Medicare | 731 | 801 | 9.5% |
| Medicaid | 598 | 632 | 5.8% |
| Unemployment insurance | 27 | 26 | -3.7% |
| Veterans’ benefits | 110 | 119 | 8.6% |
| Other | 480 | 505 | 5.1% |
| Transfer receipts, from business (net) | 53 | 55 | 2.6% |
| Less: Contributions for government social insurance, domestic | -1,357 | -1,423 | 4.9% |
| Less: Personal current taxes | -2,078 | -2,186 | 5.2% |
| Disposable personal income | 15,742 | 16,438 | 4.4% |
But all last year, the year-over-year growth rate of disposable income was diminishing, after peaking at 6.7% in August 2018. In December, the year-over-year growth rate was down to 3.6%:
The moolah per capita
Disposable income per capita rose 3.9% to $50,036. This number is based on disposable income divided by the population count (328.5 million), and is heavily influenced by the top group of earners with vast incomes. On an inflation-adjusted basis, disposable income per capita rose 2.5%.
How much did folks save?
Personal savings for the year is defined as what is left over of disposable income after all personal outlays have been made. In 2019, the total amount saved rose 8.4% from 2018 to $1.31 trillion. The personal savings rate for the year was 8.0%.
Consumers are in pretty good shape, “in aggregate…”
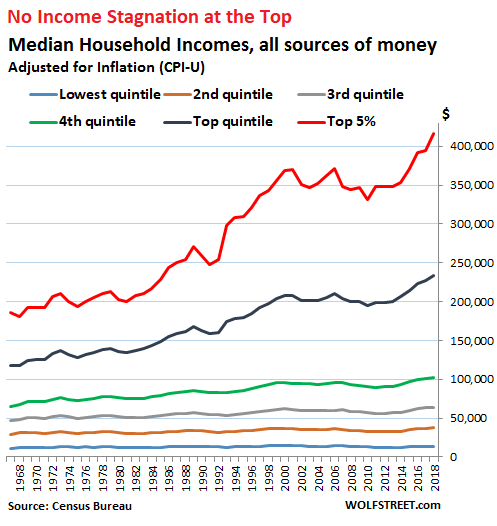
Consumers “in aggregate,” however, are heavily skewed by a small group of very wealthy, very high-income consumers. This statistical skew is caused by the extraordinary income-and-wealth disparity in the current economy, where central bankers have done everything possible to increase this income-and-wealth disparity through the “wealth effect,” as they called it – making wealthy asset holders even wealthier by inflating all asset prices, so that they might spend a little more. This likely helped GDP a little, and it certainly did a wonderful job of boosting incomes at the top:
And this is where these “in aggregate” numbers get in trouble.
For example, American consumers saved $1.3 trillion in 2019 “in aggregate” according to the above data. But survey after survey shows that about half of American households have essentially no savings, and are living from paycheck to paycheck, many of them with big balances on their credit cards. Credit card debt now exceeds $1 trillion.
But those consumers who owe $1 trillion on their credit cards are not the ones that saved $1.3 trillion last year. That’s another group of consumers. And it’s not the top group of consumers that is likely to get in trouble, it’s the bottom 50% or 60% or even 70%. That’s where there are little or no savings, and where people are engaged in a mad dash every month to make ends meet. But “in aggregate,” it looks pretty good.