the bear market infection is spreading around the world! pic.twitter.com/6QbeKbvx1R
— Alastair (@StockBoardAsset) October 27, 2018
The market has only just begun a correction from being extended 3-standard deviations above the long-term mean. 1999, 2007 and 2015 were previous instances. $SPY $TLT https://t.co/uSCQxCkyTF pic.twitter.com/JpOsx55amw
— Lance Roberts (@LanceRoberts) October 27, 2018
QT finding traction.
The #moneyprintingpump is turned off. pic.twitter.com/pK1xAMeNip— Chris Carolan $=1/∞ (@spiralcal) October 26, 2018
#DJT another WALL👇…of worry
H&S Pattern
Same Structure 2007-08 TOP pic.twitter.com/a30lx1FANe— Antonio Pérez-Algás (@apanalis) October 26, 2018
https://twitter.com/OccupyWisdom/status/1056267768096538624
Global mkts have lost another $2tn in mkt cap in this week's rout as investors reacted heavily to multiple high-profile 3Q results misses as well as fairly tepid batch of global macro data. Since Jan high, global stocks lost $15tn in value, equal to combined GDP of Eurozone & UK pic.twitter.com/qBAEW4g5Dp
— Holger Zschaepitz (@Schuldensuehner) October 27, 2018
For reference for how emotional cycles/expressions of exogenous market events tracks. Here is a chart we will add more data and content to as time goes. This versions contains $NDX added to the view. All charts are daily scaled to match approx 1st drawdown off the top ref $INDU pic.twitter.com/mI2mD1JQ4j
— mcm-ct.com (@mcm_ct) October 27, 2018
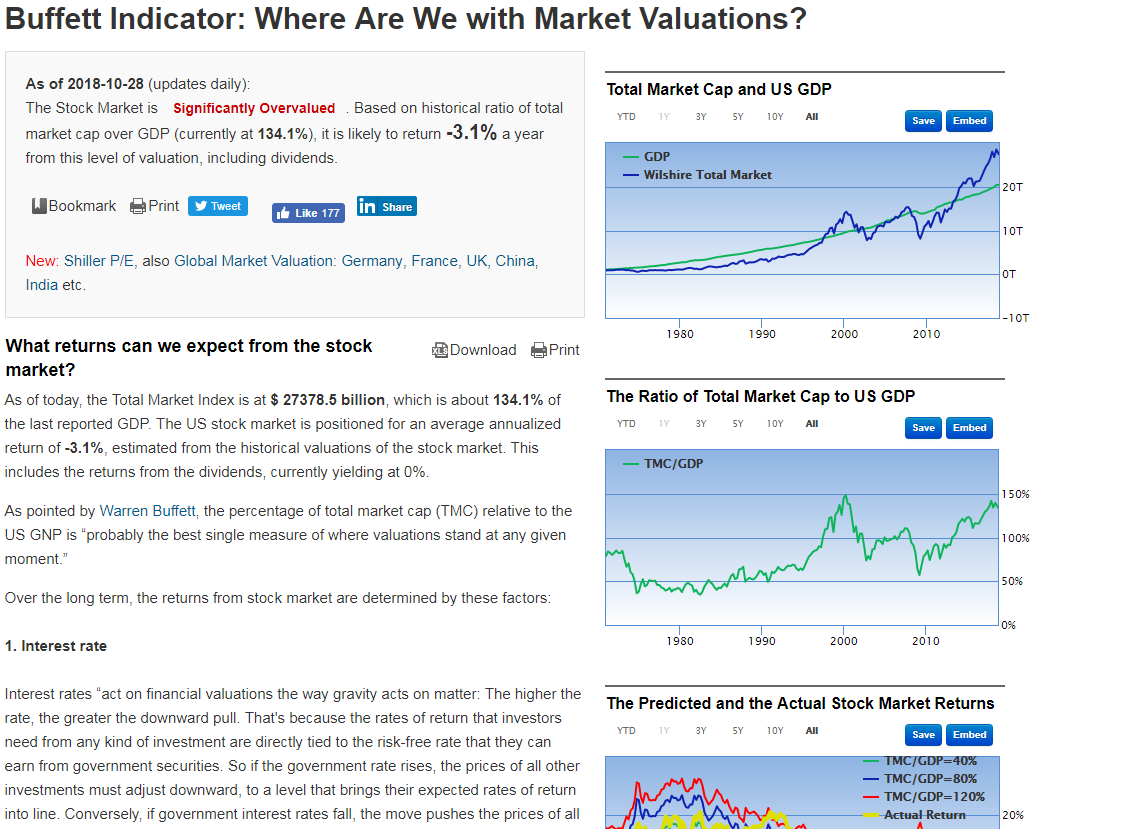
Buffett Indicator: Where Are We with Market Valuations?
https://www.gurufocus.com/stock-market-valuations.php
As of 2018-10-26 The Stock Market is Significantly Overvalued. Based on historical ratio of total market cap over GDP (currently at 134.1%), it is likely to return -3.1% a year from this level of valuation, including dividends.
h/t chillingniples