On Tuesday, I discussed the issue of the markets being stuck between various short and longer-term moving averages. To wit:
“Despite those more macro-concerns, the market has had a phenomenal run from the ‘Christmas Eve’ lows and has moved above both the Oct-Nov lows and the 50-dma. This is clearly bullish in the short-term for investors. With those levels of previous resistance now turned support, there is a little cushion for the bulls to hold on to.
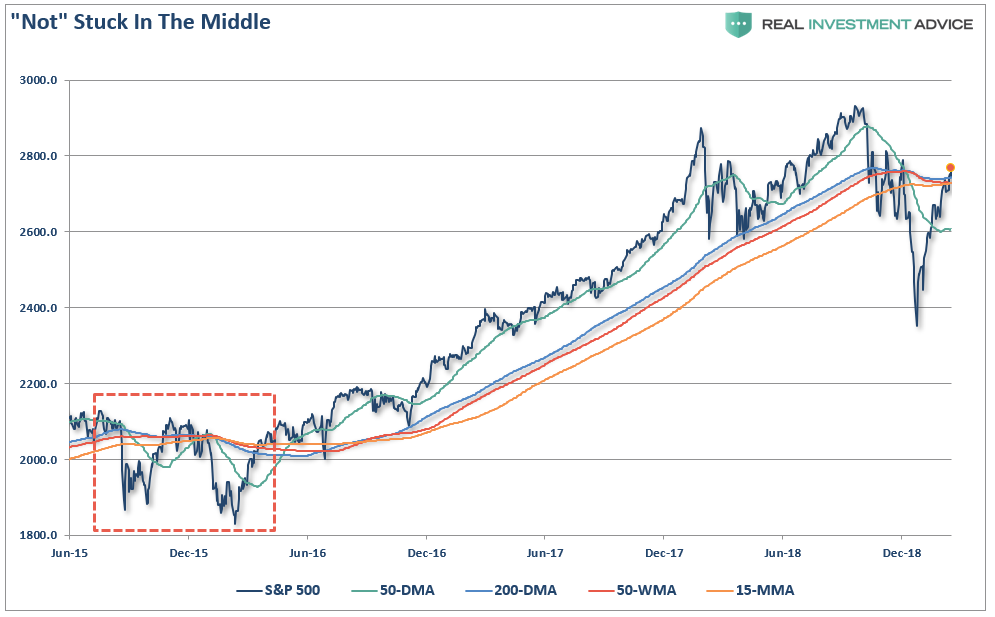
The biggest hurdle for a bullish advance from current levels is the cluster of resistance sitting just overhead. Sven Heinrich noted the market remains stuck below the collision of the 200-day, the 50-week, and the 15-month moving averages.”
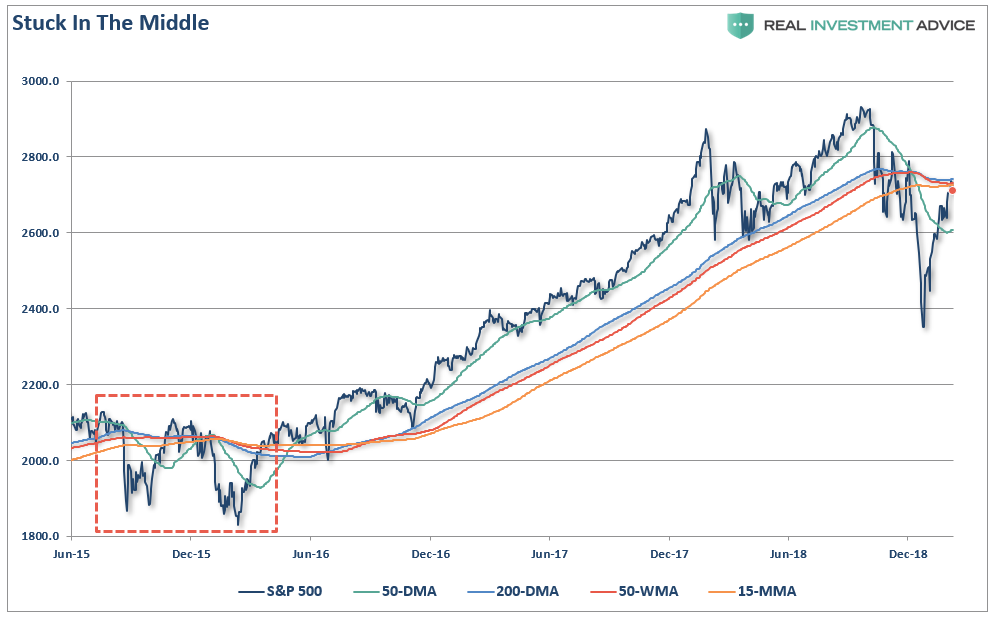
“As shown, this set up previously existed back in late 2015 and early 2016. The initial challenge saw the market actually break back above the cluster of resistance, which “sucked the bulls” back into the market before setting new lows.”
There are two things driving the advance currently.
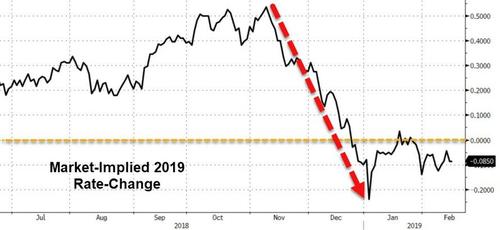
The first, is the Fed.
As we discussed with our RIA PRO subscribers (use code PRO30 for a 30-day free trial) last week,
“Today, [Cleveland Fed Reserve Governor Loretta Mester] all but put the kibosh on further rate hikes and, per Mester’s comments, will end balance sheet reduction (QT) in the months ahead.”
John Rubino also made an important note in this regard as well.
“Take the world that we were in over the past five years and flip it upside down. For the Fed, the risk that another rate increase could cause significant economic harm outweighs the risk that not raising rates could lead to slightly higher inflation.” – Gennadly Goldberg, TD Ameritrade.
And with that, the odds of a rate “hike” in 2019 have evaporated in favor of a rate “cut.”
However, the problem for the Fed is that they have now effectively “boxed” themselves in. As John notes:
“If caving to the stock market re-energizes the bond market, leading corporations to increase their already record-high debt load, that will boost economic growth while raising both inflation and commodity/real estate prices – thus forcing the Fed to go back to tightening, thus causing chaos in the financial markets, thus forcing the Fed to back off and return to easing. And so on, with each iteration ratcheting up overall leverage in the economy.”
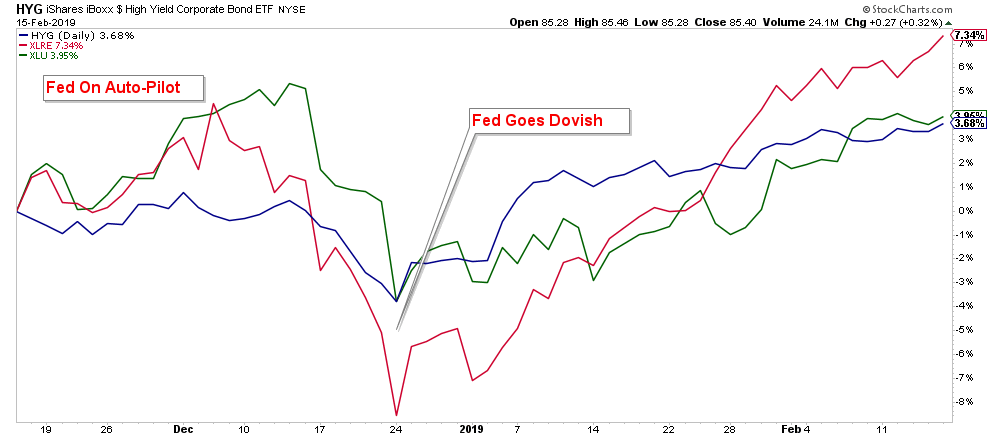
Opps….Too Late
(Real Estate, Junk Bonds, & Utilities)
The second, is “hope.”
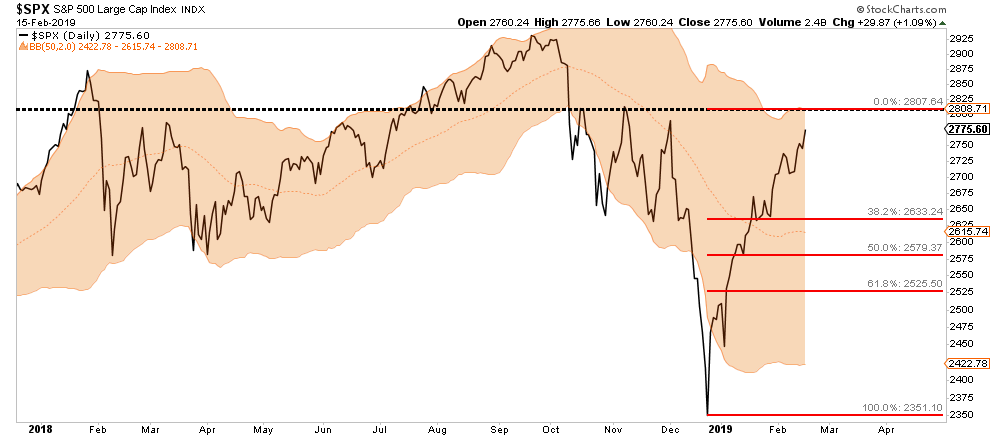
On Friday, on headlines that talks are continuing with China, the market pushed through those resistance levels as shown below.
While there is nothing wrong with “hoping” for a positive outcome from “trade talks,” the rush to “buy” equities has effectively “priced in” the best of all possible outcomes. This leaves investors vulnerable a whole host of possible disappointments:
- Trade deal isn’t reached as China refuses to give in to demands for economic reform.
- Trade deal is made but the magnitude of concessions is disappointing.
- Trade deal gets extended, again, with no real progress towards a “deal.”
- Trade deal made and tariffs are ended, but such is likely already priced into current asset prices.
- Trade negotiations collapse. (Worst possible outcome.)
The point here is that there are few outcomes for the trade deal which are extremely optimistic which would support a further surge in assets prices. The most likely outcome is this simply a “buy the rumor, sell the news” type event, and if the news is bad, the resulting sell-off could be substantial.
Market Has Gotten Way Ahead Of Itself
As I noted last weekend:
“While I am not suggesting that the markets are about to suffer a 10% correction, I am suggesting, as I wrote this past week, is that the markets have been ‘Too Fast & Too Furious.’
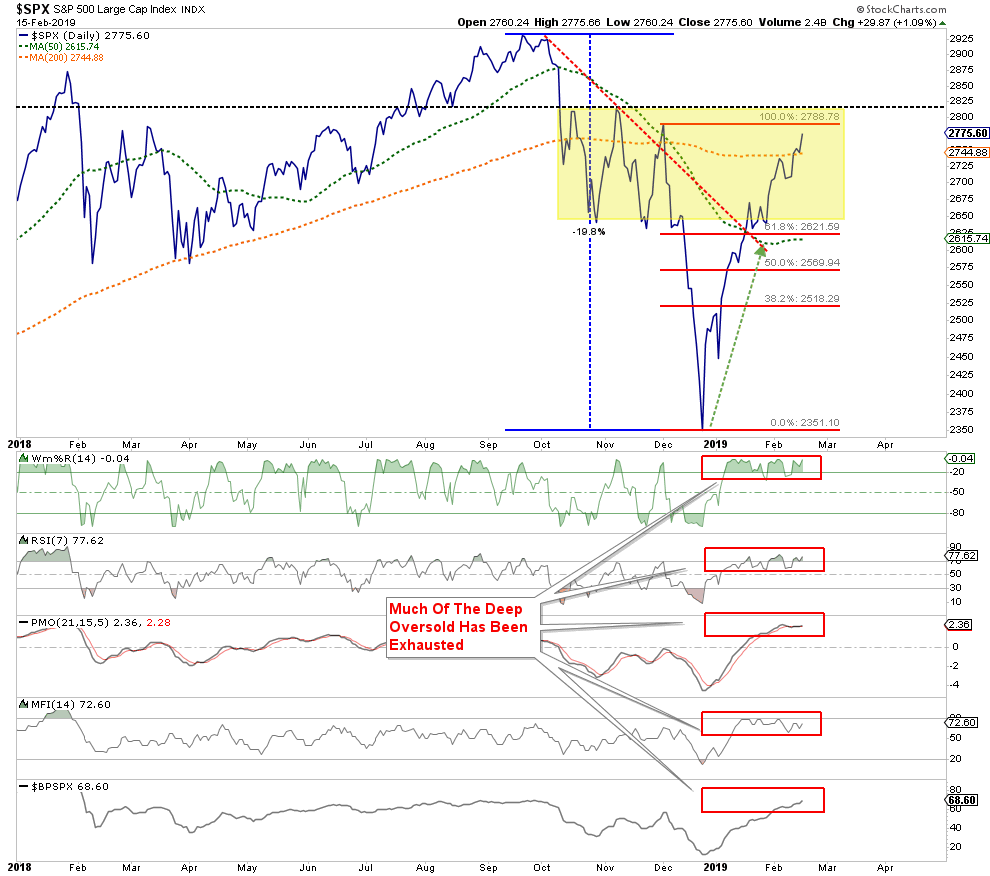
“Short-term technical indicators also show the violent reversion from extreme oversold conditions back to extreme overbought.
(Chart updated through Friday’s close)
Don’t forget to grab a cup of coffee and start your trading/investing day with me as I kick off my new radio show.
Streaming Live On The Web

As we have discussed previously, price movements are very much confined by the “physics” of technicals. When deviations from underlying moving averages become to great, reversions to mean tend to occur with great regularity throughout history. The chart below shows the S&P 500, the slope of the advance, price momentum, and its deviation from the 50-day moving average.
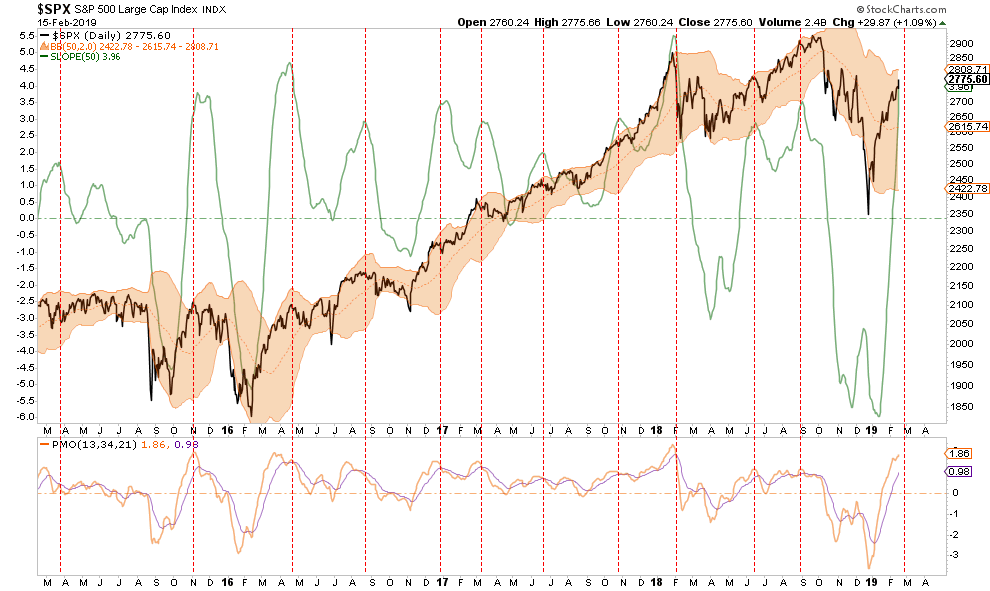
Not surprisingly, when markets are as extended as they are currently, price corrections have not previously been too far away. Given the magnitude of the advance from the December 24th lows, we can use a Fibonacci sequence to “guesstimate” the magnitude of a corrective process.
First, I am making the assumption the momentum of the market continues to push stocks toward the psychologically important level of 2800 on the index over the next few days.
A correction following that rally SHOULD be highly anticipated.
Level 1 = 38.2%: The first correction to relieve some of the extreme overbought condition of the market, and provide investors with a better opportunity to increase equity risk is at the 38.2% retracement level. This would be a retest of the support levels from the Oct-Nov lows and the 50-dma. (Bullish)
Level 2 = 50%: If the markets are unable to hold support at the Level 1 correction, then a fall to the 50% level is highly likely. Such a correction is much more bearish in nature and suggests a retest of the December 24th lows is probable. (Bearish)
Level 3 = 61.8%: If the markets get to this level, it is likely the markets will be oversold short-term and a bounce likely. However, that bounce should be sold into as a retest of lows is highly likely. (Very Bearish)
This analysis also corresponds to the extremely rapid reversion of both technical and sentiment measures.
As Mark Hulbert noted on Friday:
“That’s because the mood has shifted from the extreme pessimism that prevailed in late December to nearly as extreme optimism today. Some call current conditions a ‘slope of hope.’”
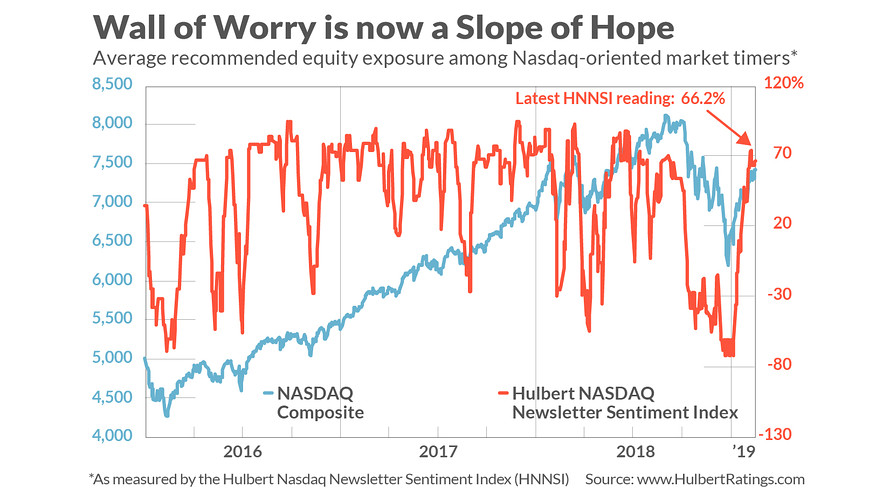
“In other words, as you can see from the accompanying chart, in six weeks’ time this group of short-term stock-market timers has increased their average equity exposure by more than 140 percentage points: Away from being aggressively bearish (recommending that clients allocate three-fourths of their trading portfolios to short-selling) to being almost as aggressively bullish (now recommending that three-fourths of clients’ portfolios be long).
To be sure, this does not mean that a decline back to the December lows is imminent. Nevertheless, contrarian analysts are convinced that the sentiment winds are no longer blowing in the direction of higher prices.”
The same is true for our proprietary technical indicator which measures the “overbought/oversold” conditions of the market. In 8-weeks, this indicator has reversed from one of the lowest reading in 25-years back to levels starting to push more extreme historical conditions without a corrective process along the way.
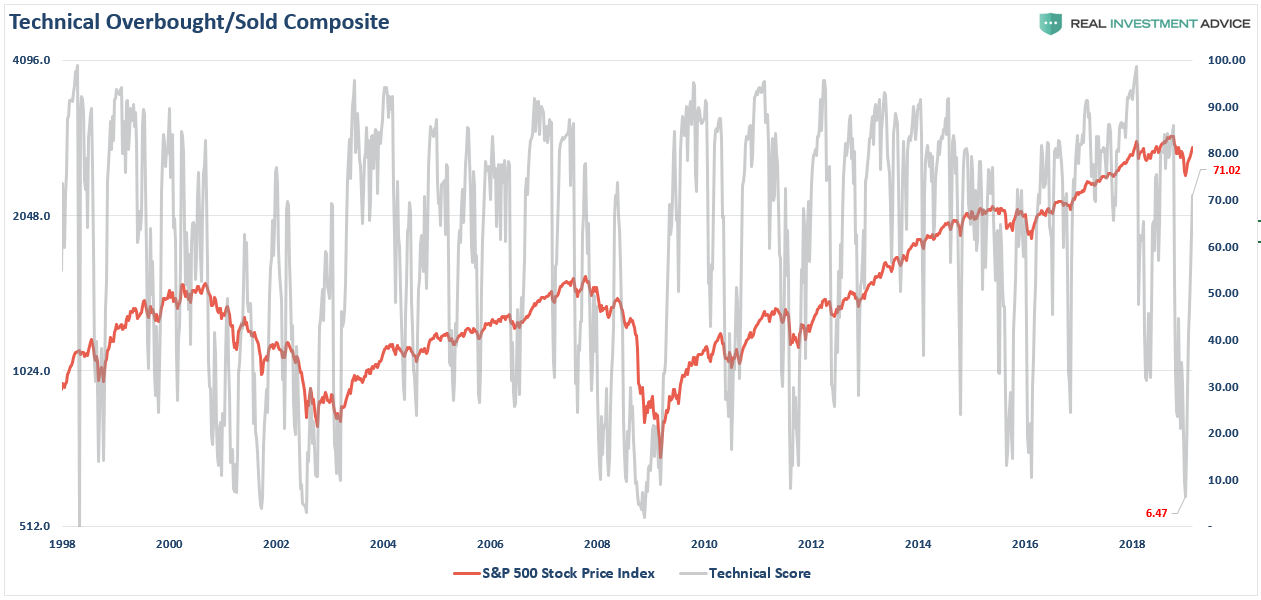
The important point here is that from a contrarian standpoint, markets have gotten way ahead of the underlying fundamentals. While the market may indeed end the year on a higher note, it will most likely not do that without lower prices first.
Like the 2015-2016 process noted in the “Not Stuck In The Middle” chart above, the bulls got “all excited” when the market broke above the confluence of moving averages at that time. Over the next 2-months, the markets set new lows.
This is a classic “bull trap” in the making which sucks investors in before inflicting as much pain as possible.
Erring to the side of caution, for now,, will likely be the right choice.
See you next week.