A flat USD-curve could be a sign for long-term investors to load up on EM again, especially relative to cyclicals, as the ISM index will likely continue south. EUR/USD range bound with a downward bias.
TABLE 1: OUR CURRENT LIST OF CONVICTIONS
First, before engaging in more esoteric stuff, we offer some FX quickies for those of a tactical persuasion.
- EUR/USD: range-bound with a downward bias. Wedge broke lower as a result of Italian politics. If 1.1510 doesn’t hold, 1.1448 is next. Below that the next support level is 1.1187.
- EUR/NOK: rising excess bank liquidity a seasonal problem for the NOK even as a first rate hike beckons. Shorts should stay away for a few more weeks.
- EUR/SEK: stuck in a wedge. We look for a break on the upside due to the Riksbank’s newfound focus on too-low services inflation. Core inflation will disappoint the coming week.
- EUR/GBP: Above 0.90 it could look interesting to be long GBP again from a risk/reward perspective. Bank of England seems to have a low tolerance for a weaker GBP.
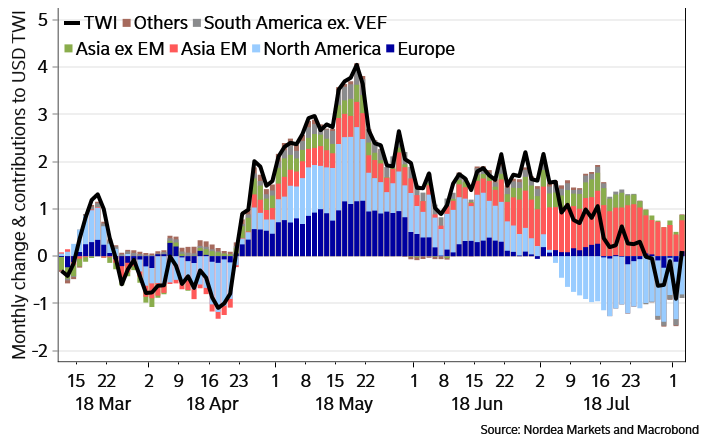
You would think that the trade-weighted dollar would have reached new highs because of the recently soaring USD/CNY, the weakening of the TRY, and more. This is not the case however. Looking at a decomposition of the trade-weighted USD, we can see that, while weaker currencies in EM Asia are contributing to a stronger dollar, this has been offset by moves within North America, especially the plunge in USD/MXN. Also, Europe and South America has not been contributing much to a stronger dollar lately.
CHART 1: DRIVERS OF THE TRADE-WEIGHTED DOLLAR
Our latest EM Traffic Light highlighted a large rise in the risk level of the TRY, driven by inflation and a change in rating. Will CBRT be able to calm markets given the choices by Turkey’s Erdogan to “bananaify” his country, related geopolitical developments and general economic weakness? It looks like Turkey is stuffed, and it’s not even Thanksgiving yet…
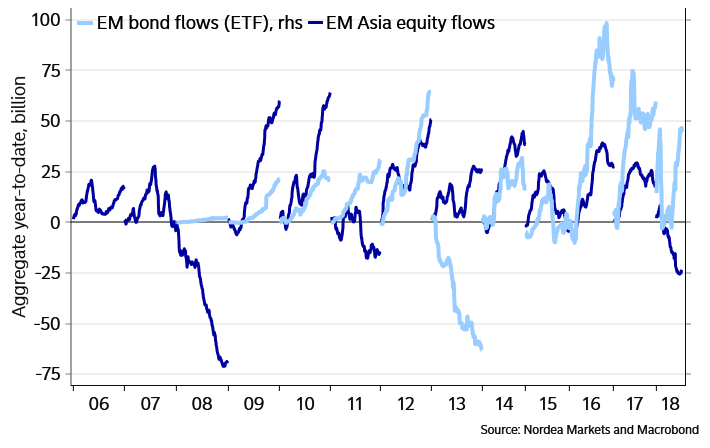
CHART 2: FLOW SITUATION FOR EM MAY BE IMPROVING
Turkey may still be stuffed, but the capital flow situation for EM appears to be improving. EM bond inflows (via ETFs) have been picking up recently, and EM Asia is no longer experiencing equity outflows. This improving flow situation could reflect i) EM pick-up now high-enough to attract inflows, and/or ii) the US 10y yield failing to break higher as well as iii) the flattening of the US curve may also be encouraging such flows (as it alleviates tantrum fears).
With the US expansion now the second longest ever, energy-price base effects on inflation about to turn less positive, dollar-negative comments from the White House, and front-loaded contributions to benefit plans of mid-September maybe it’s time to back up of the truck and load up (on EM)?
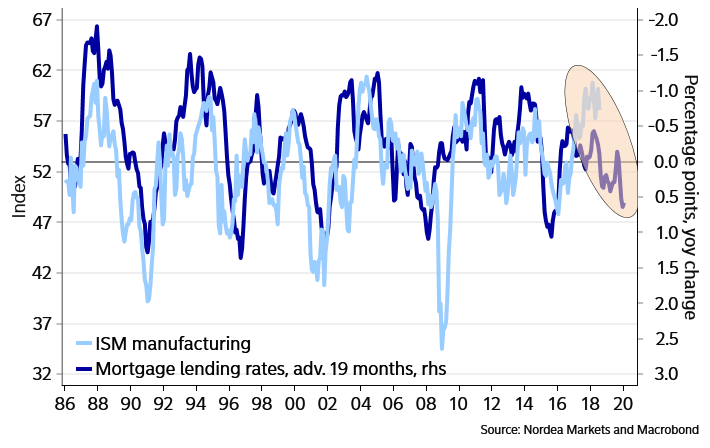
CHART 3: AND US’ ISM SENTIMENT SURVEYS TO WEAKEN
The Fed’s latest missive is not conducive to that view: “information received since the Federal Open Market Committee met in June indicates that the labor market has continued to STRENGTHEN and that economic activity has been rising at a STRONG rate. Job gains have been STRONG, on average, in recent months, and the unemployment rate has stayed low. Household spending and business fixed investment have grown STRONGLY. … The stance of monetary policy remains accommodative, thereby supporting STRONG labor market conditions and a sustained return to 2 percent inflation.” Sounds like the Fed wants to tell us something. Sure enough, both the ISM manufacturing and the non-manufacturing gauge have been more than just a little resilient this year.
However, both should face downside pressure based on eg: i) the past rise in mortgage rates (denting consumption), and ii) the recent rise in the dollar (denting the profit-outlook in local currency). In July, ISM non-manufacturing weakened the most in a year, bringing down the ISM non-manufacturing gauge to its weakest level since August 2017. This is a sign of what’s to come, we believe.
CHART 4: THE EURODOLLAR CURVE IS MORE LIKELY TO BE RIGHT THAN CYCLICAL EQUITIES
If ISM starts to weaken (as we expect), then the rate market is correct in pricing a flat ED$ curve for 2020 (the ED10 vs ED6 spread is currently showing the Dec20 vs Dec19 ED$ spread). The equity markets’ pricing of cyclical equities is likely to be wrong, in our view.
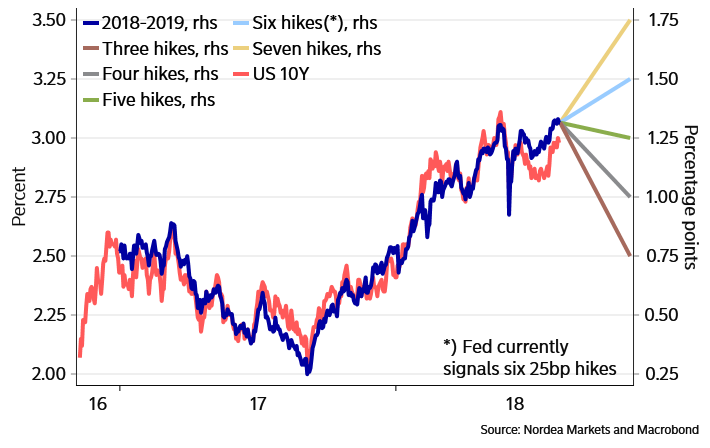
CHART 5: HOWEVER, HIGHER US YIELDS COULD FOLLOW IF THE DOT-PLOT IS REVISED
The Fed poses a short-term risk to this view. Despite Fed tightening, US financial conditions are as expansive as a year ago. Maybe some officials could discuss a quicker hiking pace? Or maybe a hike in the R-star could be in the offing? We have earlier argued that the Fed’s signal of a low neutral rate via its dot-plot likely serves as a ceiling for forward rates, helping keep rates and yields lows via depressed term premiums but that “…going forward not only could the dollar’s [2017] depreciation inform the Fed that neutral rates are now higher. A pick-up in core inflation, in productivity growth would also point in this direction…”
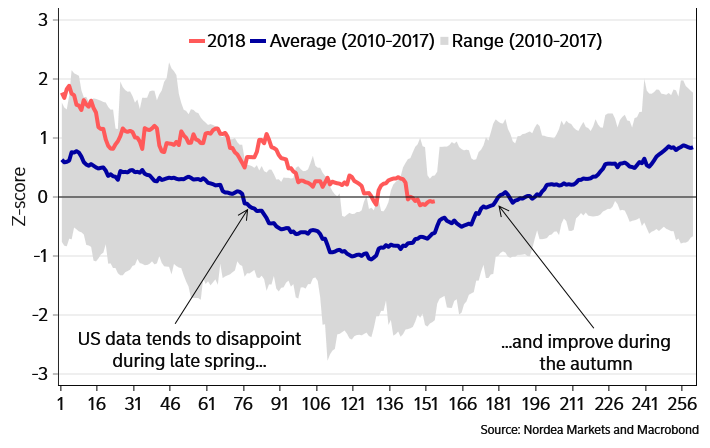
Higher US yields, posing a threat to EM, may follow if the dot-plot is revised. Higher US yields would also follow if the FI market stopped being so negative on the economic outlook for the US. Incidentally, the time is ripe for a turn-around in the US economic surprise index… US data usually improves during the autumn. But this time should be different (see chart 4).
CHART 6: WILL US DATA START TO SURPRISE POSITIVELY(!?)
To sum up this esoteric part, we do think that the flattening of the US curve means that longer-term investors should start to “back up of the truck and load up (on EM)”, though we would stay far away from currencies such as the TRY (Turkey is stuffed) and the ZAR (Zimbabwefication)… For all that, we would consider going long EM assets vs cyclicals, given the likely trajectory of ISM (lower).
ANOTHER SUMO SOMA DAY HAS PASSED
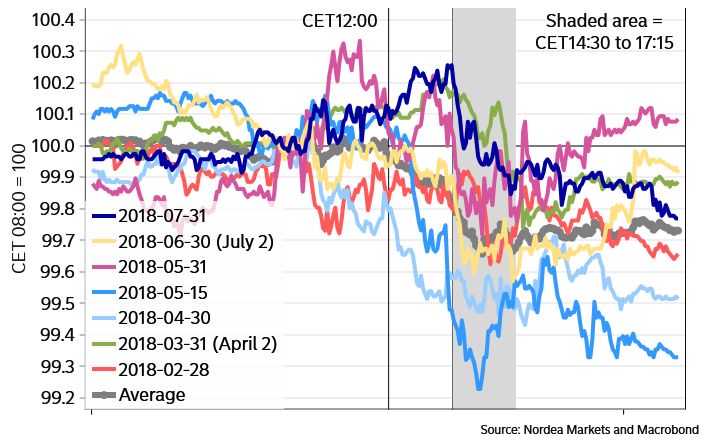
We have earlier concluded that the USD tends to gain on days when the Fed’s balance sheet shrinks due to maturing bonds & notes. We call these days “SOMA days”, since the maturing bonds are held in the Fed’s System Open Market Account. US markets recently experienced the largest SOMA liquidity shrink so far (July 31), when bonds worth 28.5bn came due. The negative impact on US excess liquidity was -24bn, which was the monthly maximum as set by the Fed.
CHART 7: EUR/USD INTRADAY ON SOMA DAYS
While EUR/USD initially rose on July 31 due USD selling for month-end reasons and a disappointing core PCE inflation reading, it eventually came under downside pressure in line with the now-usual pattern. Indeed, of the SOMA days since February 28, it has been a good idea to sell EUR/USD at CET14:30 and close the position a few hours later. The hit ratio of going long DXY at CET09:00 on SOMA days, and closing the position CET17:30 is 100% since February…
While the hit ratio for being long dollars on SOMA day is more than respectable, being short the S&P500 future on SOMA days has not worked out as well. While the SOMA days of February through May corresponded to equity market weakness, this was not the case in June and July.
TABLE 1: BEING LONG DOLLARS ON SOMA DAYS OFTEN A GOOD IDEA
The next large liquidity withdrawal due to a SOMA day takes place on August 15 when USD23.1bn comes due (causing a net liquidity withdrawal of USD12.6bn) followed by a 20.9bn maturity on August 31 (causing a net liquidity withdrawal of USD11.4bn). Mark your calendars.
BOE: A BIASED VIEW ON THE STERLING
Even as we (and many others) were caught a little by surprise by the very united voting composition in Bank of England’s MPC last week, we got our short GBP bias right. But after having digested the inflation report and the communication from Bank of England, we are getting increasingly convinced that Bank of England doesn’t want a much weaker GBP from here.
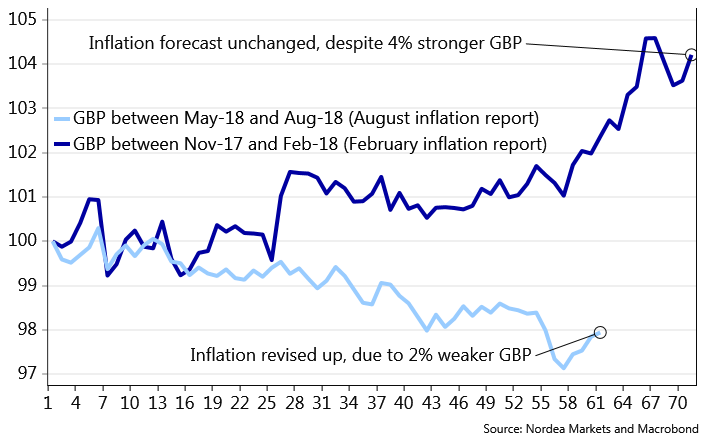
Back in February-18, the material strengthening of the Sterling in trade-weighted terms (Approx. 4% stronger) since the November-17 inflation report, suggested that the inflation outlook should have been revised down by around 0.3% for 2018. Bank of England opted against revising inflation projections lower (as they obviously should have done, having observed inflation since Feb-18). In the aftermath we wrote that “Neither on growth nor on inflation, do we see any material upside risks to the Feb-18 projections from the BoE inflation report…we still see the best risk/reward in betting on no hikes from BoE over the spring – e.g. via short cable.” Who got that one right? (FX weekly – The liquidity tide is ebbing)
Last week Bank of England on the other hand revised the inflation forecast UP, as a consequence of a 2% weaker GBP since the inflation report in May-18. Neither wage growth nor unemployment outlooks had improved since May-18 (rather the contrary) – so neither of those variables were behind the upwards revision to the inflation forecast.
There is not a lot of doubt in our minds that Bank of England will be negatively surprised on inflation again this autumn, but the important take-away from the August inflation report is that Bank of England has a biased GBP view. A strong GBP doesn’t matter a lot for the inflation outlook, but a weak GBP does. Bank of England seems to have a very low tolerance for a weaker GBP, which is why a level above 0.90 in EUR/GBP would make us consider a short.
CHART 8: A STRONGER GBP DOESN’T MATTER, BUT A WEAKER GBP DOES. BOE DOESN’T WANT A WEAKER GBP.
CHF: IS LONG EUR/CHF FROM 1.15 CONSIDERED A FREE OPTION?
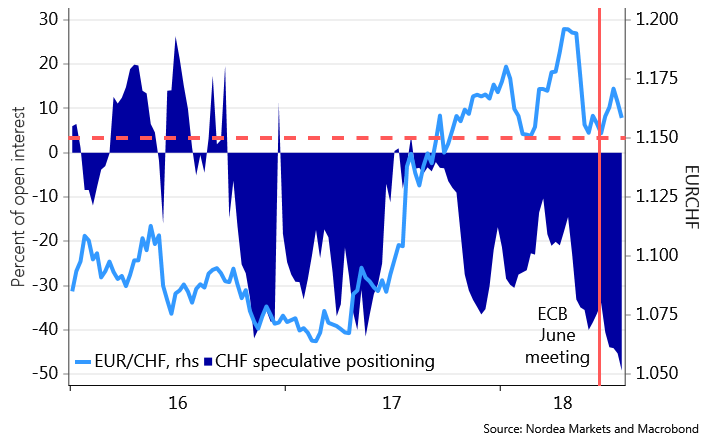
The summer has marked a big increase in CHF shorts among spec-accounts and especially since the June ECB meeting, the market has increased the short-bets to new record levels. The underlying reasoning is pretty straight forward. The SNB will be the last western central bank (maybe in competition with BoJ) to take a step towards a higher policy rate, why the CHF will perform poorly.
Furthermore, it is evident from sight deposit data that the SNB have safeguarded the 1.15 level in EUR/CHF on a couple of occasions so far this year. This makes us a little worried that the market is increasingly betting that being long EUR/CHF from levels just above 1.15 is a free option, as the SNB will make sure that 1.15 is not breached on the downside.
Do we need to remind our readers that the SNB is not scared of pulling the rug from out under EUR/CHF, if the pressure increases too much? The big increase in CHF shorts, even with no real upwards momentum in EUR/CHF, is a little worrisome. We will monitor the development very prudently in terms of our short CHF/PLN bet, which was partly taken with the 1.15 level in EUR/CHF as an argument.
CHART 9: SHORT CHF BETS INCREASE, AS EUR/CHF HOVERS ABOVE 1.15
AUD: IS IT TIME TO TAKE PROFIT IN SHORT AUD/USD?
We have been short AUD/USD since early in the year (from levels around 0.80), on the expectation that fading USD excess liquidity (due to QT) would cause trouble for Asian EM FX (with negative spill-overs for the AUD).
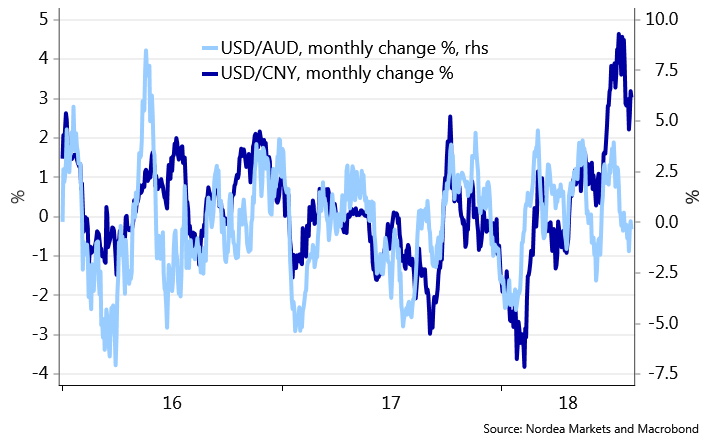
The China factor is obviously important for the AUD, but recently the AUD has fared relatively well despite the massive weakening of the CNY versus the USD. Since 2016 it has been a rule-of-thumb that if CNY weakened 1% versus the USD, the AUD weakened 2% (see chart 10). But despite running monthly changes in USD/CNY of +4% recently, AUD/USD has moved more or less sideways.
We stick to short AUD/USD for now as Trump has been on a tariff-spree on Twitter again this weekend, but look for levels to take profit. Levels below 0.73 would make us take profit.
We also stick to short NZD/JPY instead, as it seems like much purer “US curve flattening” bet, which should also perform in a turbulent trade scenario. (FX weekly – What’s that curve?)
CHART 10: IF CNY WEAKENS 2%, AUD USUALLY WEAKENS 4%. BUT NOT RECENTLY.
PREVIOUS FX WEEKLIES:
·FX weekly: How to trade a cease-fire? (29 Jul)
·FX weekly: What’s that curve? (22 Jul)
·FX weekly: The China Factor (15 Jul)
·FX weekly: Take a short trade war breather (08 Jul)
·FX weekly: Trump will never #238 (01 Jul)
·FX weekly: The USD is the best carry currency in the world (24 Jun)
·FX weekly: Dollar to provide headwinds for earning estimates (17 Jun)
·FX weekly: Fire and fury risks for the USD (10 Jun)
·FX weekly: It’s not only Italy.. (03 Jun)
·FX weekly: The Sumo SOMA days (27 May)
·FX weekly: EM won’t be sprinting, if the Fed is unprinting (20 May)
·FX weekly: The two final nails in the dovish FOMC-coffin (13 May)
·FX weekly: Is there anything left in the USD bull-run? (06 May)
·FX weekly: Dragon Energy (29 Apr)
·FX weekly: Relative curvature is the new king of FX (22 Apr)
·FX weekly: Why is EUR/USD not trading lower? (15 Apr)
·FX weekly: Like watching paint dry, they said (08 Apr)
·FX weekly: The list of potential USD-positives is getting longer (01 Apr)
·FX weekly: 2 reasons why EUR/USD has decoupled from rates spreads (25 Mar)
·FX weekly: Time to buy a USD lottery ticket? (18 Mar)
·FX weekly: Taxation mirror on the wall, who is the fairest of them all? (11 Mar)
·FX weekly: Trump’s game of chicken (04 Mar)
·FX weekly: Will the market neglect the clutch of canaries? (25 Feb)
·FX weekly: Is the correlation break-down driven by FX hedges? (18 Feb)
·FX weekly: The liquidity tide is ebbing (11 Feb)
·FX weekly: Hawkish spectacles (04 Feb)
·FX weekly: Who will stop EUR/USD from moving higher? (28 Jan)
·FX weekly: Did the Democrats dent the Dollar? (21 Jan)
·FX weekly: Is 1.25 the new 1.20? (14 Jan)
·FX weekly: The euphoria rises (07 Jan)
·FX weekly: Paging Dr. Pangloss (01 Jan)
·FX weekly: The R-star of Bethlehem (24 Dec)
·FX weekly: A numbers game (17 Dec)
·FX weekly: The year-end liquidty shrink (10 Dec)
·FX weekly: Three reasons why EUR/USD isn’t trading lower (03 Dec)
·FX weekly: Which currencies to sell if the housing downturn continues? (26 Nov)
·FX weekly: The global industrial cycle is set to weaken (19 Nov)
·FX weekly: Is high-yield a canary in the global coal mine? (12 Nov)
·FX weekly: Is this the end of the inflation convergence trade in EUR/USD? (5 Nov)
·FX weekly: Was that it for the EUR bulls? (29 Oct)
·FX weekly: Hawks in opposition, doves in charge (22 Oct)
· FX weekly:Continued convergence or re-divergence?(15 Oct)
·FX weekly: Thingsdon’t matter until they do(08 Oct)
·FX weekly:“October seasonality is strong” (01 Oct)
·FX weekly:“Is 1.20 the new 1.15?”(24 Sep)
· FX weekly:Honey, I shrunk the balance sheet(17 Sep)
· FX weekly: “USD liquidity will turn scarcer, but when?” (10 Sep)
· FX weekly:“Strong currencies and inflation”(3 Sep)
· FX weekly:“USD in the (Jackson) hole” (27 Aug)
· FX weekly:“Q4 is the USD quarter”(20 Aug)
· FX weekly:“In the year 2525”(13 Aug)
· FX weekly:“EUR/USD ceiling or debt ceiling?”(6 Aug)
· FX weekly:“Elevator up, stairs down “(30 Jul)
· FX weekly:Trump “spices” up EUR/USD(23 Jul)
· FX weekly:Flip-flop?(16 Jul)
· FX weekly:Consolidation time?(9 Jul)
· FX weekly:Hawks R Us(2 Jul)
· FX weekly:Another lowflation week?(25 Jun)
· FX weekly:No Fed put?(18 Jun)
· FX weekly:A bouncy dollar?(11 Jun)
· FX weekly:Heating up(4 Jun)
· FX weekly:Summertime sadness(28 May)
· FX weekly:Special counsel lessens Trumpbulence, while OPEC looms(21 May)
· FX weekly:Are China worries old hat?(14 May)
· FX weekly:Inflation week…(7 May)

