by Chris Vermeulen of The Technical Traders
We have been focused on the upside price move in Gold and Precious Metals, we’ve been engaged in multiple private conversations with members and friends about the potential for a renewed debt crisis between now and the end of 2020.
This research post should help to put some perspective into what we believe the next 16+ months of trading and what the US economy should look like for our followers.
First, we want to talk about one of our most favorite topics of the past 24+ months – the “capital shift” phenomenon. We first identified this facet of global economic dynamics back in 2015 or so.
As the global economy shifts focus on risks and opportunities, capital shifts with these expectations and moves away from risks and into investments that are seen as opportunistic and safer. This dynamic is still very much at play within the global markets.
Second, we want to discuss global Central Banks and their attempts to spark growth after the 2008-09 credit crisis event. Even though Global Central banks have continued to spark some type of fundamental economic growth over the past 9+ years, these QE activities have also produced a very high level of debt arising from extended government spending, consumer spending and lack of real savings initiatives. While governments and central banks were chasing the “gold ring” of inflation, they lost focus on the fundamental elements of the economy which are debt levels, price valuation levels and future operational capabilities with regards to debt vs. income.
Recently, the Bank of International Settlements (BIS) issues a scathing annual report suggesting the global Central Banks have been negligent in properly managing debt levels, QE functions, and fundamental economic policies in an attempt to continually chase growth and inflation. BIS Review by Bloomberg.
Third, Gold and precious metals have started to rally from levels near historical low points. This increased upside price activity is a very clear sign that FEAR and GREED have re-entered the global markets and that global investors/traders are starting to react to unknown and unseen potential risk factors. Are they reacting to future trade issues, future debt issues, future growth issues?? What is it?
The reality is, we never really know until the event is complete as the hind site is 20/20. What really matters is understanding that this type of money flow is happening and that we have a way to track and forecast these levels of fear and greed.
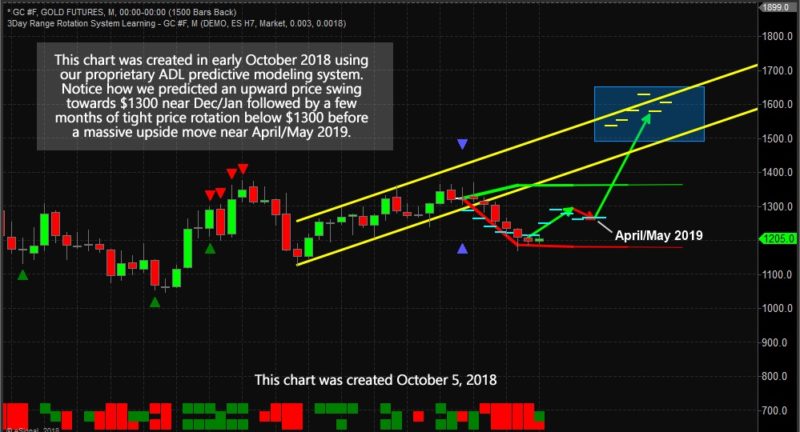
The gold chart below shows our expected price of gold forecast from October of 2018. As you can see, we identified the bottom and rally, then the more recent bottom in April/May, and today we are experiencing the extended rally (fear/greed) driven rally.
Not only can we accurately forecast gold long term moves but we can also pinpoint short term bottoms and tops using our intraday cycle and fear/greed tools as shown here.

Forth, the breakout economy in the world, the US, is not something that happened by chance. After the 2008-09 global economic crisis, the US entered a period of extended QE throughout President Obama’s term. The US QE functions didn’t really end until just before the 2016 Presidential Elections. Thus, from roughly 2009 till 2015, the US was engaging in some form of QE measures which supported the global Central Banks by allowing for cheap US Dollars. The continued US QE efforts allowed foreign nations, governments, and enterprises to take advantage of a very unique extended cheap US Dollar event that has now GONE AWAY.
It is our belief that this fundamental change in the US Federal Reserve, wanting to attempt to normalize rates, while President Trump’s attempt to restructure and settle more suitable trade deals with China, Europe, Mexico, Canada, and others has disrupted the apple cart – so to say.
The easy access to the US Dollar is gone. Easy trade and special deals for China and others are gone. The US economy is strengthening because of fundamental economic strength – size, capabilities, pricing valuations and the attraction of foreign capital investments.
We talked about this in great detail including how we expected the SP500 to reach 3000 and beyond months ago.

All of these points raise some very interesting questions – primarily “what is the unwinding event going to look like?”
Global Central banks will do everything within their power to push off any signs of crisis events and to foster some level of economic growth for as long as possible. We all know this to be true.
The spark all these Central Banks have been waiting for is economic growth. What happens if that growth initiates at the same time that Inflation initiates at a 2x or 3x rate? Economic growth would support increased demand for commodities and other items. This increased demand will likely prompt moderate inflation – making these items even more expensive to purchase much beyond the pricing we see now.
A combination of moderate growth and increased inflation in the US could prompt the US to raise rates even further in an effort to contain inflation. A spike in rates, at this point, could completely destroy support for current asset levels, Real Estate, Debt and other operational components of our already stressed local state and federal governments. Yikes.
We believe we know what the unwinding event will eventually become once the trigger event initiates the move. We believe it will become a price “revaluation” event where assets and commodities prices attempt to identify an “equilibrium” based on historic and current supply/demand expectations. The one caveat to this whole presumption is DEBT – what about all the DEBT?
There are some key elements of political and economic Super-Cycles that all traders must stay aware of listed below. But if you have not yet read PART I do so now.
_ Very often, 12+ months before a major US political election cycle, the US stock market typically enters a Bearish trend phase that lasts until 8+ month before the actual election date.
_ The Transportation Index has not recovered to levels from the September 2018 peak. This lower price rotation in the Transportation Index suggests the global economy is not expecting growth in the near future.
_ Other than Precious Metals, the Commodities sector has rebounded off of recent lows but has yet to see any real price advancement – suggesting that demand for raw commodities is rather weak.
_ The Real Estate sector in the US is starting to falter near a current high price level. We are seeing price decreases hit the markets as sellers are desperate to attract buyers. This could be a warning that a price revaluation event is about to unfold in the US.
_ Super-Cycles suggest a moderately sized price rotation between now and early 2020 (likely greater than 20% in size). This rotation, should it happen, will become a price revaluation event that could attempt to “shake loose” some of the sector pricing and forward expectations we’ve mentioned (above).
Our bigger concern is the localized state and federal pension and retirement issues that continue to respond with higher levels of financial commitments and greater levels of annual budgets as related to ongoing capacity and operational activities in the US.
If an unwinding event was to unfold in or near 2020, it is our belief that a pricing revaluation event related to any of the core economic factors above (particularly with Real Estate, Economic Cycles, the US Presidential Elections, and a soft/weakening US economy) could result in a much larger price revaluation event taking place. This would create extended pressures on local State and Federal expenses and highlight debt issues that can often be hidden behind “creative accounting” tricks.
State and Local Government Debt Securities and Loan Liability levels have stayed elevated, yet somewhat flat over the past 10+ years. It is very likely that these debt levels have been contained because of the US easy money policies of the past 10+ years. When the US Dollar is cheap and easy to repay, these debt levels don’t look so difficult.

Pension and retirement systems/fund are a completely different story for State and Local government agencies. Asset flows have dramatically increased in volatility after 2000. Additionally, the depth and magnitude of asset outflows have become quite dangerous while price revaluation events were unfolding (2000 to 2004 and 2008 to 2015). Outflows in state and federal pension and retirement funds create large forward operational pressures and shortfalls in expected funding levels. These decreases in funding should be made whole by the State or City – but they are rarely ever repaid in full.
As these “wholes” in the pension and retirement systems continue to fester (resulting in decreased funds for pensioners and decrease fund to be deployed as investment assets), the problems begin to compound over time. More and more retirees and pensioners start drawing benefits while the system continues to take in less and less – never actually catching up in total value.

One big revaluation event, or possibly two, from now and we believe the entire system will create a multiple Trillion Dollar debt crisis within the US and possibly throughout the modern world. We believe the under-estimated state and federal pension/retirement funding issue is the next shoe to drop and that it will take a price revaluation event to expose the risks that are evident within this failed “Ponzi” scheme. Read the recent news about Chicago and Illinois to learn just how dangerous these entitlement contraptions really are.
Let’s assume that a revaluation event does take place within the next 5 to 10+ years – this would be something like a Real Estate price correction or some type of stock market, asset market price correction related to local or global economic issues. Could these massive asset funds handle an extended DRAWDOWN from their funds while Cities, States, and Federal agencies attempt to deal with declining revenues? How much time would it take for these pension and retirement funds to fall into crisis or insolvency?
By our estimates, the current asset levels in the US retirement/pension system have just started to breach the lower asset level channel originating from 1970 to 1999 attribution levels. It has taken 20+ years of US Fed and global Central Bank market manipulation, as well as President Trump’s incredible US economic and stock market rally, to recover to these levels.

Overall, skilled technical traders must be aware of the risks that are ever-present for another crisis event or what we are calling a “price revaluation event” that could create havoc on anyone’s retirement accounts, trading portfolios and/or simple family life/future. We’re trying to help to highlight what we believe will be the future 16 to 24 months of pricing activity within the US Stock market based on our research tools and our experience/knowledge.
This final portion of our multiple part research post regarding the future of a crisis-like price revaluation event will focus on two components that we want to highlight for every trader, investor, and reader. It does not matter if you are invested in anything at this point – you need to read this last portion of our research because you need to plan for and prepare for this next event.
On March 31, 2019, we published this research post regarding our cycle analysis predictions and the belief that a major price cycle top would likely form in July 2019.
On June 11, 2019, we updated our research and published this post regarding our belief that current cycle forecasting suggested the top in the market would now be set up for some time in late August or early September 2019.
This SPY chart highlights what our research team believes to be the current outcome of the US stock market given our predictive modeling systems, price rotation modeling and other proprietary utilities we use to conduct our research. We believe the current upside price rally is a push to establish price levels above $300 on this SPY chart, just as we suggested in the June 11 article, and that this attempt a major psychological price level ($300) will likely become an exhaustion rally point where price immediately rotates lower – attempting to find support. We believe temporary price support will be found near $287 to $298 where the price will briefly stall and move slightly higher into August 2019.
It is at this point that our cycle research becomes critical for technical traders. This price rotation will set up a final leg to a larger Pennant/Flag formation with the potential for that last upside price leg, in August, to become a “washout high” price move. This happens when price fakes a price move/trend, causing investors to believe a breakout or breakdown more is taking place and JUMP IN, then price immediately reverses direction.
It is extremely important for all technical traders to understand our original price predictions, from March 31, 2019, and our current price predictions, from June 11, 2019, align with this current article in certain aspects. Price is going to target the psychological $300 level in the SPY. Price is going to continue forming into a Pennant/Flag formation. And the price will likely peak in late August or early September – just as we have predicted.

We expect this price rotation, or price revaluation event, to attempt to find support as we have highlighted on this chart. If these levels fail to hold as price support, then we could be in for a much deeper price revaluation event. We don’t believe that will be the case as the US elections and other factors should prevent the price from falling too far below the $245 level.
Expect some increased price volatility over the next 30+ days. Expect Gold and Silver to properly reflect the FEAR and GREED that is prevalent within the global markets. Expect many traders will be caught off guard when this $300 level on the SPY is breached as many will be thinking “we are off to the races – time to pile into the LONG SIDE”. We believe this is the wrong action to take.
We’ll keep you informed as this plays out with Wealth Building & Global Financial Reset Newsletter and if you like what I offer, join me with the 1 or 2-year subscription to lock in the lowest rate possible and ride my coattails as I navigate these financial market and build wealth while others lose nearly everything they own during the next financial crisis. Join Now and Get a Free 1oz Silver Round or Gold Bar!
I can tell you that huge moves are about to start unfolding not only in metals, or stocks but globally and some of these super cycles are going to last years. A gentleman by the name of Brad Matheny goes into great detail with his simple to understand charts and guide about this. His financial market research is one of a kind and a real eye-opener. PDF guide: 2020 Cycles – The Greatest Opportunity Of Your Lifetime
As a technical analysis and trader since 1997, I have been through a few bull/bear market cycles. I believe I have a good pulse on the market and timing key turning points for both short-term swing trading and long-term investment capital. The opportunities are massive/life-changing if handled properly.
Chris Vermeulen
http://www.TheTechnicalTraders.com