It has just been an amazing week for crude oil! We haven’t seen upward movement in WTI like we’ve seen this week in…forever, on a percentage basis. Buoyed by a dramatic shift in sentiment following an avalanche of good news generally, over a very short time span oil has rocketed higher. 
Key among this data was a crude storage report turning out to not be as bad as originally feared and on the decline. In the most recent weeks’ edition of the EIA-WPSR, a slight build was forecast, that turned into an actual decline of 0.7 mm bbls. The market loves data like this, particularly in the face of several months of increasing bearish data up to this point.

Gasoline demand going up is another well-received indicator of the market being ready to turn positive. We are driving again and using gasoline in private cars as opposed to the distillate used in big trucks used for logistics. Figures from the most recent STEO show a sharp rebound in these critical fuels.

When you fold in the fact that airlines and travel companies making plans to accommodate social distancing, and hotels are rolling out plans for deep cleaning, in furtherance of resuming service…the market simply did a happy dance on Monday the 18th, rising nearly a thousand points.
The market was also cheered by signs that the economic re-openings seem to be going manageably versus the worst fears of a sharp spike in new cases of the virus. This was capped off by Monday’s news of a very promising vaccine for Covid.
Related: Russian Oil Majors Want Bailout From Moscow

In this article we will review some of the most recent relevant data from the shale patch and make some calculations about the direction for oil and derivatives over the next few months. I’ll give you a clue, supply and demand are about to be in sharp imbalance. Shortages of oil and refined products are on the horizon. Prices will be going sharply higher and soon.
The report from the shale patch
Given all of the above, I think we’ve seen the bottom and have revised my forecasts accordingly for the rig count and frac spreads. I think this week we will see an uptick in drilling for the first time since January. Nothing to write home about, but a few new rigs will be finding contracts. It should be noted, that signs of a return to shale drilling will help to keep a cap on prices over the short run. Longer term, as noted above, we think they are going much higher and will justify that belief later in this article.
I may be too bearish on the frac spreads holding them flat through the month. Regardless it will be a little while before any real recovery is seen, given the inventory overhang.

With this data and the figures from today’s release of the Drilling Productivity Report, we can start drilling down on just where the production fall off from shale will end up.
Tenet #1- we are never going to produce 9-mm BOPD again from shale. The capacity to do that simply no longer exists.
Tenet #2- Capital will slowly start creeping back into shale as prices improve. We aren’t suggesting a sharp rebound beyond $40 for a few months and that will keep a lid on the pace of the recovery.
Tenet #3- As of now we expect a 50% decline in shale production by year’s end.
Tenet #4-Oil companies will start revaluing reserves higher in Q-3 will bring a boost to NAV’s for the first time in several quarters.
I will refer back to these tenets in the “Your takeaway” section of this article.
Drilling Productivity Report analysis
Well we have some hard data and some fairly tepid speculation from the EIA in this month’s report, curated and analyzed for you just now. It is important to understand this report is not the final word, and just extrapolates trends seen by the government dweebs who compile it. The EIA-914 is much more definitive, but lags several months.
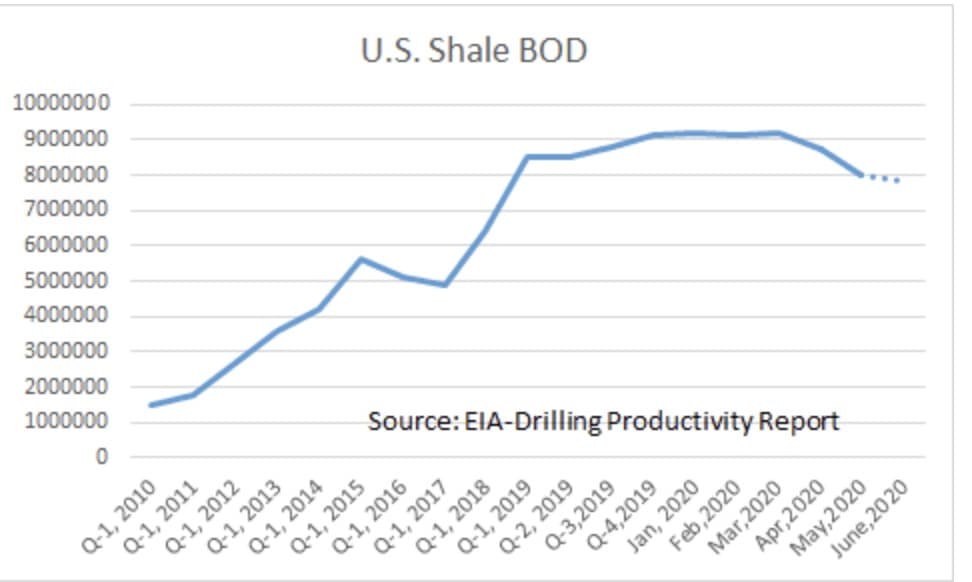
EIA For more accurate analysis we need to normalize this report with the EIA-914 due at month’s end. Production levitated from DUC activity to early March and has been dropping like a stone commensurate with declines in drilling and fracking activity.
In a prior OilPrice article, I’ve previously stated that drilling is now well below the replacement rate for new production. What does that mean? Let’s do some cipherin’.
Related: Oil Industry Faces Looming Threat Of Involuntary Outages
Using the new well rig-weighted average of 745 BOPD from each rig we can then infer a decline from lack of drilling activity. From Mar of 2020 where we were producing 9175000 BOPD we have lost 322 rigs. (322 X 745 = 239 K BOPD of new production lost). Legacy decline from March equals (9175000 X .6 = -3,670 mm annualized or /365 X 60 = 603 K BOPD) Totals from declines in activity. If you add those two together 603 +239 you can account for 842 K BOPD of lost production. That seems like it would track fairly within a margin of error with the ~.9-mm or so the EIA is forecasting down for May. When you add it to shut-in figures, the estimates of which run from 300-500K BOPD, means U.S. production is bracing for a precipitous decline, over just the month of May.
In summary shale’s decline will only accelerate for the next couple of months as new (old) data comes in. Eventually the declines will attenuate as drilling and fracking picks back up.
We stand by our earlier forecast of a 2020 exit for U.S. shale production of about 4.5-5.5 mm BOPD.
What does all of this mean on a global scale?
Global demand is running at about 86 mm BOPD currently and is forecast in the May-11th edition of the linked STEO, to rise rapidly through the rest of this to about 99 mm BOPD. With seven months left in the year we can average daily demand to be in the ~95 mm BOPD range.
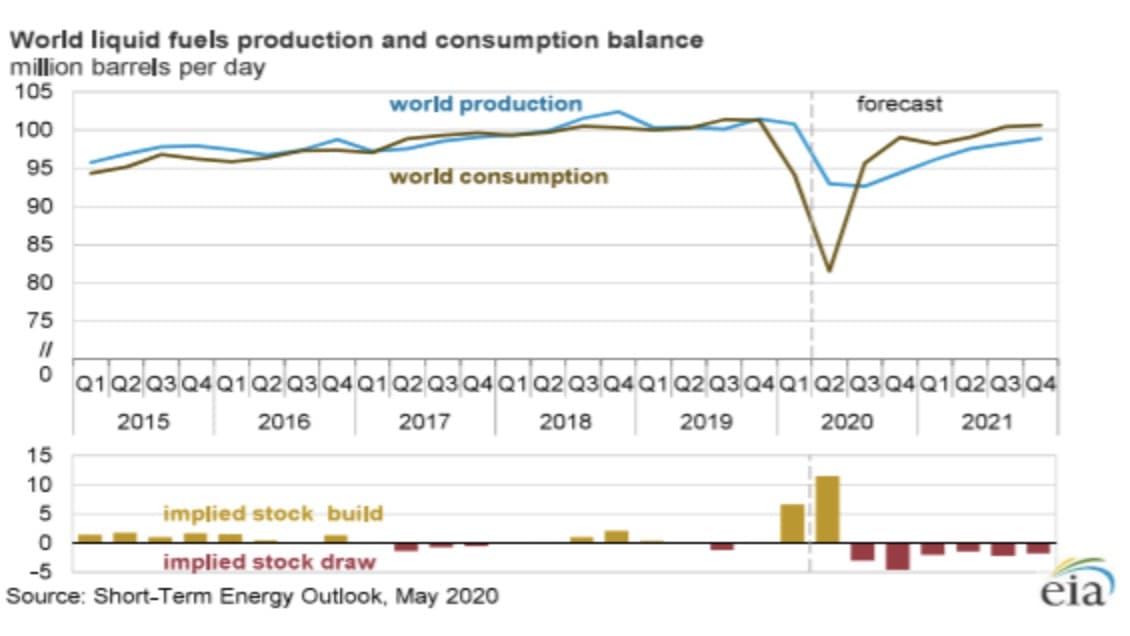
What’s happened with supply? You can see above as a result of the cutbacks from OPEC+ we are down about 10 mm BOPD from the highs of 2019. Actual figures could be several million BOPD higher when you factor in cuts from producers like Norway, Canada, Brazil and a few others.
With the cuts we have forecast and those officially announced the world could see year end production of 6-8 mm BOPD below demand forecasts. Fear of shortages or disruptions to supply often drives sharp spikes in the oil price. Witness the 15% spike of late December, 2019 when it appeared that hostilities between the U.S. and Iran could bubble over into armed conflict. This quickly dissipated as tensions cooled and other concerns began to drive the oil market.
Over recent years, supply and demand have tracked each other fairly closely. In short there is no direct analogue for the type of shortage that could be on the horizon. Simply put, we are in uncharted waters.
Your takeaway
We have put forth a reasonable case for a sharp rise in the price of oil by years end. There are no guarantees this will happen, but with the data we have seen, there is nothing in sight to deter this eventuality. This could be good news for long suffering oil equity investors.
Oil related equities continue to be sharply under-valued as downgrades of Net Asset Values have continued through this quarter. We think those downgrades are about over and oil companies will soon be able to increase their book valuations. This will drive stocks prices higher, particularly for the majors like Chevron, (NYSE:CVX) and BP, NYSE:BP) that have aggressively taken goodwill and asset write downs over the past couple of quarters.
Smart investors should review their portfolios for places to add shares at these depressed prices. Odds are they won’t stay at these levels for long.
By David Messler for Oilprice.com