The financial system is now screaming “RECESSION!”
The yield curve is perhaps the single best predictor of recessions in the world. If you’re unfamiliar with how the yield curve works works, in broad terms, there are three categories of U.S. debt: Treasury Bills or T-bills (usually short-term debt), Treasury Notes (long-term debt up to 10 years), and Treasury Bonds (long-term debt for 20 or 30 years).
Treasury Bill Maturation Periods:
4 Weeks
13 Weeks
26 Weeks
52 Weeks
Treasury Note Maturation Periods
2 Years
3 Years
5 Years
7 Years
10 Years
Treasury Bond Maturation Periods
20 Years
30 Years
The yield curve is comprised of comparing the yields on these various bonds. One of the most common ones used for economic predictions is the 2s10s: what you get when you subtract the yield on the 2-Year Treasury from the 10-Year Treasury.
Whenever the yield on the 2-Year Treasury exceeds that of the 10-Year Treasury, the yield curve is inverted. This ONLY happens before a recession. And right now, it is more inverted than at any point since the year 2000.
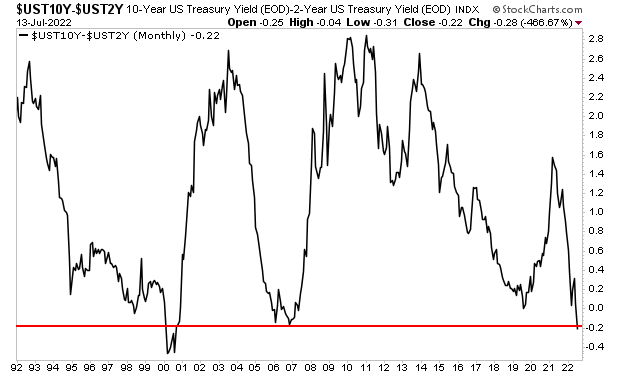
This is effectively the bond market, which is the single best predictor of recessions on the planet, SCREAMING that a recession is coming.
What does this mean for stocks?
I’ve illustrated the last FOUR yield curve inversions on the below chart. You can see what came next for the stock market.
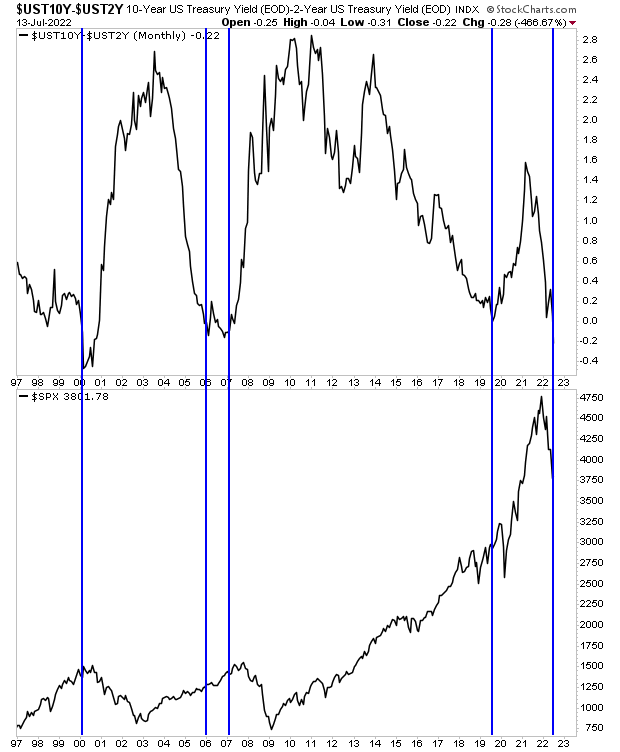
Buckle up… a crash is coming.