Instead of trying to predict when the economy will deteriorate in the distant future (which countless experts have tried and failed), we simply look for deterioration among the leading indicators. Instead of predicting the next 10 steps, we seek to predict the next 1-2 steps for the economy.
Here’s a brief summary of the leading economic indicators we track
Positive factors
- Labor market
- Corporate profits
- Financial conditions
- Loans
- High yield spreads
- Inflation-adjusted new orders
- Heavy Truck Sales
- Earnings revisions
- Inflation-adjusted retail sales
Negative factors
- Housing
- Yield curve
- Average weekly hours
Conclusion
Overall, macro points to continued economic growth. A recession is unlikely to start within the next few months.
Right now, the most likely start date for a recession is in 2020. If macro remains decent when January 2020 comes around, we will push the most likely start date for a recession even further into the future. Be flexible as the data changes.
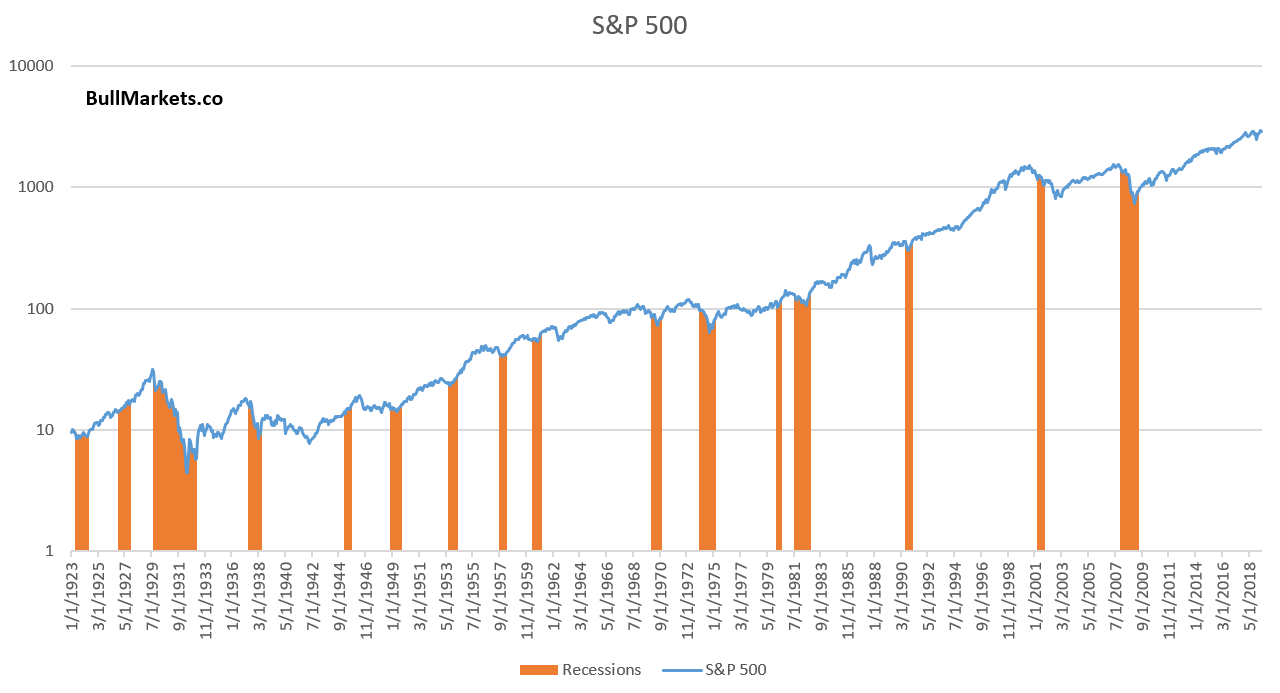
Why macro matters
The economy drives corporate earnings, which drives the stock market in the long term. As a result, bull markets usually coincide with economic expansions, and big bear markets usually coincide with recessions.

Since the stock market tends to peak before recessions begin, we need to look at leading economic indicators, which also deteriorate before recessions begin.
This doesn’t mean that the stock market’s exact top cannot occur before macro starts to peak. This happened in January 1973, when the stock market peaked a few months before macro started to deteriorate. However, the biggest part of bear markets always occur after macro has deteriorated significantly.
Positives
Labor market
Labor market indicators do not show any significant deterioration right now.
Initial Claims
Initial Jobless Claims measures the number of jobless claims filed by people who are seeking to receive jobless benefits. In other words, this measures the number of people who are recently unemployed.
The latest reading for Initial Claims decreased from 222k to 216k. More importantly, Initial Claims has been trending sideways over the past 9 months.

In the past, Initial Claims trended higher before a recession began. This is still a positive point for macro, but watch out over the next few months in case Initial Claims trends upwards because Initial Claims is very low right now.

Continued Claims
Continued Jobless Claims measures the number of people who are still filing jobless claims (past the initial claim). In other words, this measures the number of people who remain recently unemployed.
The latest reading for Continued Claims decreased from 1.699 million to 1.662 million. More importantly, Continued Claims has been trending sideways over the past 9 months.

In the past, Continued Claims trended higher before a recession began. This is still a positive point for macro, but watch out over the next few months in case Continued Claims trends upwards because Continued Claims is very low right now.

Unemployment Rate
The Unemployment Rate’s latest reading is at a low for this economic expansion (3.6%).

This is a positive point for macro because in the past, Unemployment trended sideways or upwards before a recession began.

*The Unemployment Rate lags Initial Claims and Continued Claims a little.
KC Fed Labor Market Conditions Index, Momentum Indicator
The KC Fed Labor Market Conditions Index’s latest reading increased from 0.95 to 1.033. More importantly, this index is still above zero.

According to FRED: “A positive value indicates that labor market conditions are above their long-run average, while a negative value signifies that labor market conditions are below their long-run average.” 0 is a necessary but not sufficient requirement for recessions.
The KC Fed Labor Market Conditions Index remains above zero, which means that this “necessary but not sufficient” requirement for recessions has not been fulfilled.
Corporate Profits
Figures related to corporate profits suggest that while the economic expansion is late cycle, a recession is not imminent.
Unit Profits
Unit Profit’s latest reading fell from 100.19 to 95.35. More importantly, Unit Profits has been trending sideways for years.

This is a late-cycle sign for the economic expansion. In the past, Unit Profits usually peaked mid-expansion. While this suggests that the economic expansion is late-cycle, this indicator is not a timing tool. Unit Profits can fall for years before a recession begins.
Corporate Profits
Inflation adjusted corporate profits’ latest reading fell from 8.21 to 7.9. More importantly, inflation-adjusted corporate profits are still trending higher.

In the past, inflation-adjusted corporate profits trended downwards for several quarters before recessions began. If corporate profits continue to trend downwards, this will be a negative for macro in 2019.
Financial conditions
Indicators related to financial conditions remain relatively loose. This is positive for macro.
Chicago Fed Financial Conditions Credit Subindex
The Chicago Fed Financial Conditions Credit Subindex remains very low at -0.7. More importantly, the Credit Subindex is trending sideways right now.

In a credit-driven economy, the Credit Subindex tends to trend upwards (i.e. tighten) before a recession begins.
Banks’ lending standards
The latest reading for Net Percentage of Banks Tightening Standards fell from 2.8% to -4.2%. More importantly, banks’ lending standards has not trended upwards.

In the past, lending standards tightened for several quarters before a recession began. This is a positive for macro right now.
Loans
The latest reading for Delinquency Rate on All Loans has remained the same as last quarter (1.53%). More importantly, the Delinquency Rate has been trending downwards.

In the past, the Delinquency Rate trended higher before a recession began. This is a positive for macro.
High yield spreads
From September 2018 – present, high yield spreads have been making higher lows while the stock market has made higher highs. This is a necessary but not sufficient condition for bear markets and recessions. In the past, high yield spreads trended higher before bear markets and recessions began.

In the past, high yield spreads tend to widen (trend higher) before recessions began. This is because the average bond market participant is usually more aware of risk than the average stock market participant.
Inflation-adjusted new orders
The latest reading for inflation-adjusted new orders decreased from 173.39 to 167.85. More importantly, inflation-adjusted new orders is trending up.

In the past, inflation-adjusted new orders trended downwards before recessions began (this indicator is a component in the Conference Board’s LEI). This is a positive for macro right now.
But if new orders continue to fall for a few more months, this will be a negative for macro in the second half of 2019.
Heavy Truck Sales
The latest figure for Heavy Truck Sales remained the same at 0.547 million. More importantly, Heavy Truck Sales is trending upwards.

In the past, Heavy Truck Sales trended downwards before recessions began. This is a positive for macro right now.
Earnings revisions (not the same thing as actual earnings)
U.S. Net Earnings Revisions is now slightly positive

Net Earnings Revisions demonstrates how many companies are increasing their forward earnings estimates minus how many companies are decreasing their forward earnings estimates. In the past, Net Earnings Revisions was negative when recessions started.
This is a necessary but not sufficient condition for recessions, because clearly there are plenty of false signals (see 2011-2016).
Inflation-adjusted retail sales
The latest reading for inflation-adjusted Retail Sales increased from 2024 to 2034. More importantly, inflation-adjusted Retail Sales is once again trending upwards.

In the past, inflation-adjusted Retail Sales trended sideways before recessions began. This is a positive for macro.
Negatives
Housing
The housing market – a key leading segment of the U.S. economy, shows some signs of mild deterioration.
Housing Starts
The latest reading for Housing Starts decreased from 1281k to 1269k. More importantly, Housing Starts is trending sideways/downwards.

In the past, Housing Starts trended downwards before recessions began. This is a negative for macro.
Building Permits
The latest reading for Building Permits increased from 1,290k to 1,294k. More importantly, Building Permits is trending downwards.

In the past, Building Permits trended downwards before recessions began. This is a negative for macro.
New Home Sales
The latest reading for New Home Sales decreased from 723k to 673k. More importantly, New Home Sales is trending sideways.

In the past, New Home Sales trended downwards before recessions began. This is neutral for macro.
NAHB Housing Market Index
The latest reading for the NAHB Housing Market Index decreased from 66 to 64. After trending downwards in 2018, this leading indicator is starting to recover on the whole despite the drop in latest reading.

In the past, the NAHB Housing Market Index trended downwards before recessions began. This is a slight negative for macro right now, but could turn positive if it continues to improve for another few months.
Monthly Supply of Houses
The latest reading for Monthly Supply of Houses went up from 5.6 to 5.9. More importantly, this indicator is trending sideways.

The Monthly Supply of Houses looks at the ratio of houses for sale vs. houses sold. In other words, it’s a measure of inventory in the housing market and how hard it is for sellers to sell. The higher this ratio, the tighter the housing market becomes.
In the past, the Monthly Supply of Houses usually (but not always) trended upwards before recessions began. This is neutral for macro right now.
Yield curve
Various sections of the yield curve have either inverted or are close to inverting.
Here is the popular 10 year – 3 month yield curve, which has already inverted.

The 10 year – 3 month yield curve tends to invert 1-1.5 years before a recession begins. The more accurate recession signal occurs when the 10 year – 3 month yield curve steepens after inverting (Fed cuts short term rates as the economy falls into a recession). This has not happened yet.
Here is the 10 year -2 year yield curve, which currently stands at 0.3% (close to inverting).

Like the 10 year – 3 month yield curve, the 10 year – 2 year yield curve tends to invert 1-1.5 years before a recession begins. This has not happened yet.
Overall, the inverting yield curve is a slight negative for macro right now. While this is extremely hyped up in the media and financial media, the yield curve is merely one of many macro points to consider.
Average Weekly Hours of Production and Nonsupervisory Employees: Manufacturing
The year-over-year % change in average weekly hours rose from -1.88% to -0.95%. More importantly, this figure is negative right now.

In the past, this figure was usually in negative territory when recessions began. This is a slight negative factor for macro right now.
This is a necessary but not sufficient condition for recessions, because clearly there are plenty of false signals.
Valuations
And lastly, a quick word on valuations. The U.S. stock market’s valuations are extremely high right now, as they’ve been for most of this decade. You know it, I know it, everyone knows it.
Here’s the popular Tobin’s Q ratio

Here’s the popular Shiller P/E ratio

However, valuations on their own don’t cause bear markets. Recessions do. Valuations are like the powder, and recessions are like the spark. Higher valuations = more dry powder, which means that when the next recession does hit, the explosion will be bigger.
- High valuations + recessions = big bear market
- Low valuations + recessions = big correction.
So while the bears say “valuations are high, stocks will crash!”, that is merely stating the obvious. Valuations are meant for predicting 10 year forward returns. “Eventually” stocks will always crash. But valuations have very little impact on where the stock market will go over the next month, 6 months, 1 year, 2 years, etc. For example, “valuations are high = poor 10 year forward returns” might mean that the S&P goes up 5 years and then falls 5 years.
These are the S&P 500’s 1 year and 2 year forward returns vs. its valuation (P/E ratio). Notice how the correlation between the stock market’s valuation and 1-2 year forward returns is weak.
R squared = 0.0765 and 0.0646


Shiller P/E consistently peaked at approximately 22 from 1900 – 1994. But from 1994 – present, valuations have been consistently higher. Here’s what happens when you sell the S&P when Shiller P/E reaches to 22. As you can see, a strategy that worked pre-1994 no longer works post-1994.
