The Tremor Before the Quake and the Fed’s $450 Billion Balance Sheet Reduction
“The combination of rate hikes and balance sheet reductions from the Federal Reserve in 2018 sucked up global U.S. dollar liquidity and put emerging markets under immense pressure in 2018. Emerging market equities were 20-30% lower from February through October, then the S&P played catch-up to the downside.This, combined with tariffs from the White House, has placed global manufacturing in a significant slowdown that has begun to circle back into the United States. After all, over $60T of global GDP is OUTSIDE the USA.” – Lawrence McDonald, “Fed Cave-athon Driving Stocks Higher For Now“
Why did Fed Chairman Jerome Powell’s comments on Friday get such a ringing endorsement from the equity market?
The answer is simple.
The driver to market movement is not valuations. Rather, it is the degree of the system’s liquidity condition.
Valuations generally don’t matter much when liquidity is injected and expanding price- earnings ratios don’t end bull markets.
But when markets perceive a drying up in liquidity or central bankers pivot, as in late 2018, markets suffer.
Watch the money!
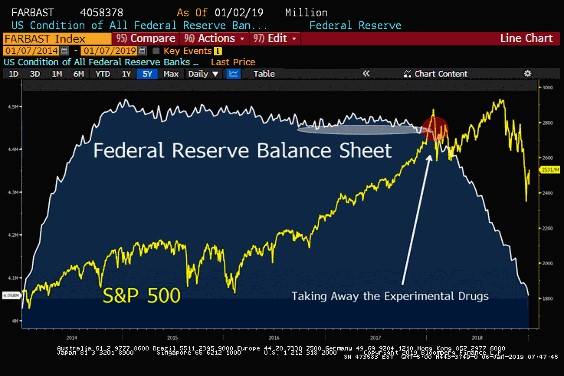
The problem is not rising interest rates in 2019. Regardless of the Fed’s actions this year — and I continue to believe there will be no fed fund hikes this year — the bloated Fed balance sheet will be running off as quantitative easing (QE) is reversed.
The relationship between liquidity and capital markets volatility is inversely related. That is why in the first half of 2018 I called for a new regime of volatility, which we have gotten in spades since late September 2018. And that is why I see a continuation of heightened volatility throughout this year.
Tightened Liquidity
Last week, Dennis Gartman produced this chart of the declining monetary base:
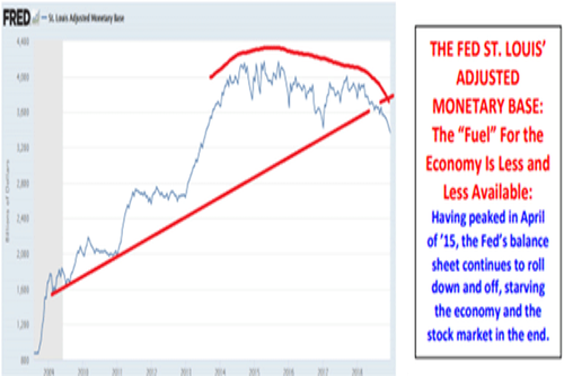
My pal John Mauldin, after seeing the above chart, asked Dr. Lacey Hunt to explain the ramifications. Here was his response:
“There are two important equations that show the potential power of the monetary base (MB):
-
M2 = MB x m (the money multiplier);
-
World Dollar Liquidity = MB + Foreign Official Holdings of US Treasury Securities
#1 means that that the base is not money but that it can be turned into money but only if little m cooperates. The determinants of little m are known, unlike those of the velocity of money. Currently, MB is declining and m is countervailing to a slight degree, but the drop in the base and the increased Federal funds rate has resulted in sharp slowdown in M2 growth from a peak of 8% per annum to slightly less than 3.9% per annum now. Slower M2 growth resulted in a sharp slowdown in nominal GDP in the third quarter of 2018.
In the fourth quarter velocity of money appears to have declined and combined with slow M2 growth has resulted in an even lower rate of growth in nominal GDP. This trend should continue well into 2019. Thus, the academic economist would say that the aggregate demand curve is shifting downward, cutting the upward sloping aggregate supply curve at a lower rate of growth in nominal GDP, with a reduced pace of growth in both real GDP and inflation.
#2 means that world dollar liquidity declines when the base falls unless it is countervailed by an increase in foreign official holdings of Treasury securities. Both of these components constitute tier one capital and can be leveraged. Presently, both components of world dollar are falling, draining liquidity in global markets. Tangible signs of this include: a sharp slowdown in M2 growth in Japan, the Eurocurrency zone and China, a drop in world stock and commodity prices as well as synchronized deceleration in major foreign economies. Chinese money growth recently fell to the lowest in four decades, while Japanese money growth was below the trough in two of the last three recessions. Equation #2 holds as long as the Fed is de facto the world’s central bank.
One other point: Excess reserves have declined far more sharply than the monetary base, serving to severely restrict the US depository institutions. Excess reserves have dropped from a peak of $2.7 trillion to $1.6 trillion. Quantitative tightening cut excess reserves about approximately $400 billion while the first eight hikes in Federal funds rate reduced excess reserves about $700 billion. We don’t have sufficient data post the ninth increase in the funds rate to yet measure its impact. QT, if sustained, will reduced excess reserves $50 billion per month in 2019 or $600 billion for the year. Thus, excess reserves would drop to slightly less than $1 trillion by the end of this year.”
Peter Boockvar noted last week that in the fourth quarter of 2017 the combined asset purchases of the Fed, European Central Bank (ECB) and Bank of Japan (BOJ) were $100 billion per month. The total dropped to zero in late 2018 and this quarter will turn negative, to withdrawals of roughly $20 billion per month.
This is a lot of liquidity coming out of the financial system.
As worrisome is the extended nature of the worldwide economic recovery that is now petering out and the political turmoil on our shores.
The Path of Global Economic Growth Has Grown More Ambiguous
The data below underscore the weakening trajectory of worldwide growth:
China: 52.4 to 49.4
Germany: 63.3 to 51.5
Eurozone: 60.6 to 51.4
Canada: 57.1 to 53.6
United States: 61.3 to 54.1
Recent data are worsening. As an example, Germany’s factory orders (just announced) fell by 5%, the greatest amount in six years.
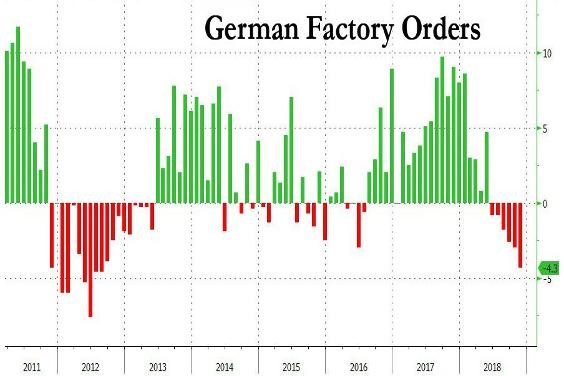
Source: Zero Hedge
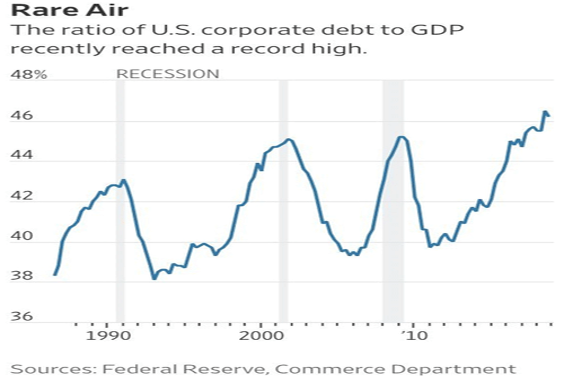
Meanwhile, the Ratio of Corporate Debt to GDP Makes A New High
A zero interest rate policy made debt a far cheaper source of capital than equity, and corporations responded in kind by borrowing from banks and accelerating issuance of debt in the public market.
But, as I have written, debt loads in both the private and public sectors are untenable and pose substantive cycle risks.
Credit markets have grown concerned with the economic slowdown and spreads have widened considerably in the last two months.
And Then There Is the Political Turmoil (Read: The Orange Swan)
* Hastily crafted policy conflated with politics, written on the back of a napkin and delivered by tweet, is joining the other risks of declining liquidity and lower economic growth.
* The disruption of the post-World War II world order by the current administration raises market and economic risks in an increasingly flat and interconnected world.
Bottom Line
“Never make predictions, especially about the future.” –Casey Stengel
I am not arguing whether Jay Powell’s pivot on Friday was right or wrong. I am arguing that money moves markets.
Leading up to late last week, market participants had grown more bearish.
That helps to explain, with the market on the verge of retesting December’s lows on Thursday, why the markets rose with so much vigor in Friday’s trading session.
Money flows move markets more than any other single independent determinant.
Regardless of the Fed’s action or inaction on interest rates this year, the liquidity risks are growing at the feet of a slowing global economy and amid political turmoil.
To use John Mauldin’s term, we were “living dangerously” late last year, and that condition likely will continue in 2019.
As to the market consequences, declining liquidity likely will serve as a governor to the upside and should provide a tailwind to the continued regime of volatility.
With so many market participants poorly positioned after Thursday’s schmeissing and with the growing pessimism in investor sentiment, I sense some runway toward higher prices over the near term.
To me, a pattern similar to 2011 seems possible.
By means of background, in 2011 the Spyders opened the year at $127, rallied to $135, dropped to $117 and closed the year at about the same price they started the year.
2019, seen as 2011:
* A beginning-of-the-year rally (an overshoot above my 2400-2500 S&P fair market value) as the markets are relieved about the Fed’s more dovish narrative and that Powell may not pressure liquidity as much as previously feared
* A first-half retest of the prior lows as it becomes clear that the U.S. economy will deliver only 1% to 2% real GDP growth
* Another liquidity rally taking us upward at year-end (where we started 2019) as the specter of QE4 moves closer to reality following a negative GDP print in the third quarter of 2019