by Dana Lyons

We would have titled this post “Trend-Setting”, except we already used that title for a post a few weeks ago. The genesis of that post — as with this one — was our weekly #TrendlineWednesday feature on our Twitter and StockTwits feeds. We don’t typically pen a blog post based on our #TrendlineWednesday offerings, but the number of key markets and key trendlines in play at the time warranted a post. After a few weeks of a failed equity market bounce, we’re seeing many of the same trendlines being tested once again — or broken. Additionally, while the prior post focused heavily on indices and securities from the stock market, this week we also see a number of key trendline tests from across the financial market spectrum. And since the resolution of such trendline tests may well determine the direction of the most important markets in the world, we felt another post was warranted.
First off, following the selloff of the past few days, we find many equity indices involved in tests of important uptrends. To wit:
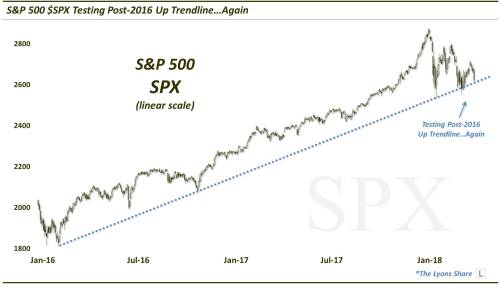
The S&P 500 is testing its post-2016 Up trendline…again…
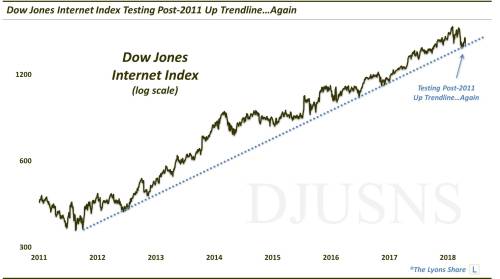
…the Dow Jones Internet Index is testing its post-2011 Up trendline…again…
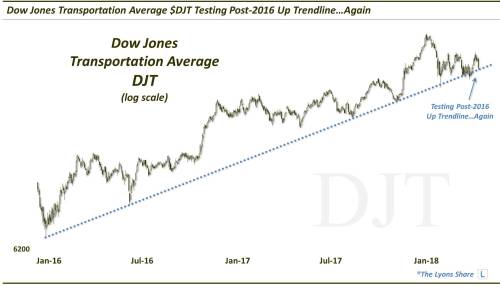
and the Dow Jones Transportation Average is testing its post-2016 Up trendline…again.
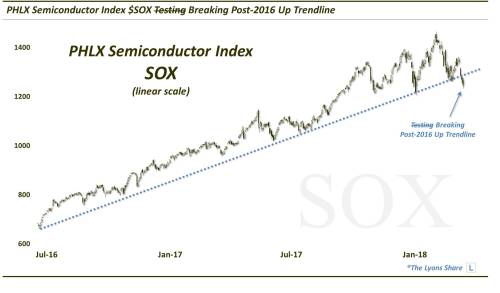
Meanwhile, in a development that bulls are hoping is not a foreshadowing of the resolution of the aforementioned trendlines, the PHLX Semiconductor Index (SOX) is breaking its post-2016 Up trendline.
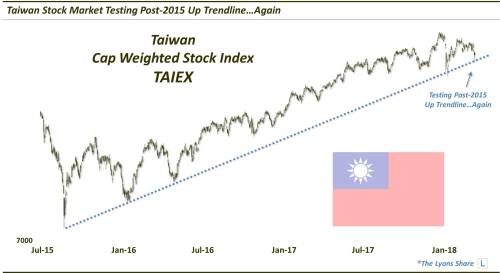
In overseas equity action, we see the Taiwanese benchmark stock average testing its post-2015 Up trendline once again as well.
As mentioned, though, current trendline tests are not reserved only for stocks. Other asset classes are seeing trendline-related developments that could have major implications on the movement of financial markets. Perhaps the most important of these is the U.S. Dollar Index breaking its year-long Down trendline.
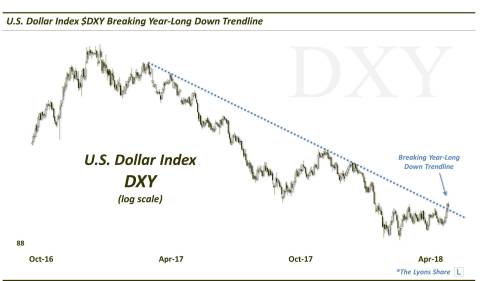
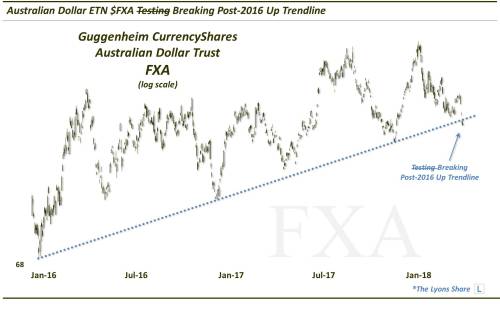
Obviously developments surrounding the U.S. Dollar will have serious implications for other currencies, e.g., the Australian Dollar (via the exchange-traded product, FXA) threatening to break its post-2016 Up trendline.
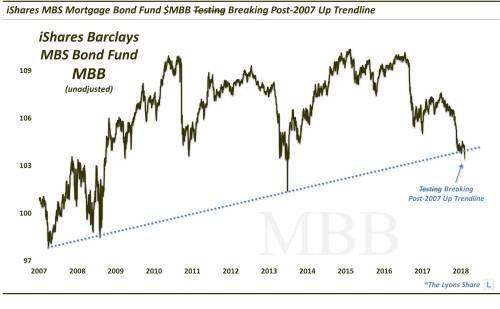
Not to be outdone, the bond market, across the spectrum, is under siege due to new highs in the U.S. 10-Year Yield. This includes the iShares Mortgage-Backed exchange-traded fund, MBB, apparently breaking its post-2007 Up trendline.
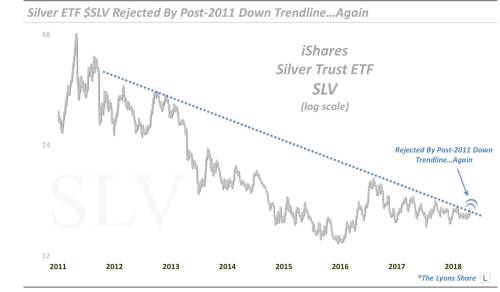
Even the commodity world is home to noteworthy trendline happenings now, like the iShares Silver fund (SLV) getting sharply rejected (again) by its post-2011 Down trendline.
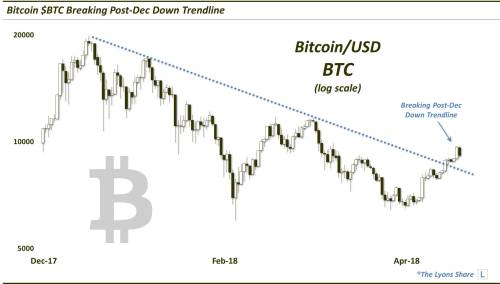
And no, we didn’t forget about you cryptos. In recent days, Bitcoin has (perhaps importantly) broken above its sharp post-December Down trendline.
So as you can see, there is no shortage of action in the financial markets out there. And that is based only upon trendlines, the simplest of technical charting techniques. Make no mistake, these trendlines work (for real) and are important developments. However, there are plenty of other key charting developments of a more complex and potentially more important nature under way at the moment…and just about every day for that matter.