by UPFINA
We generally don’t discuss whether stocks are overbought or oversold because the usefulness of the information is short lived. Because of this, you know stocks are really at an extreme moment when we do discuss it. Currently, U.S. stocks are extremely overbought. They are having a bigger Santa Clause rally than normal. As of Thursday, the 14 day RSI was at 74.23. It likely got higher after the rally on Friday. It peaked at 76.78 on November 27th and never fell below 50 before increasing again. There wasn’t a true correction after stocks were very overbought then. That’s why stocks have gotten expensive recently. According to Credit Suisse, the S&P 500’s forward multiple is 1 standard deviation above normal.
The S&P 500 has been up in 10 of the past 13 days and is up 28.61% year to date. It’s up 29.8% year over year because we are lapping the bottom last year. That’s the best yearly gain since December 27th, 2013. This market is a mirror image of last year as stocks declined almost 20% last fall. The max drawdown this year has only been 6.84%. The average max decline is 16.3%, but that’s pushed higher by a few very bad years. Even still 2019 has been a very tepid year.
The VIX is at only 12.48 which is low. It’s not as low as it was in 2017, but that was one of the most tepid years ever. 2019 has had a little more volatility and better returns. The CNN fear and greed index is at 91/100 which is extreme greed. It’s slightly below its peak in November. We are finally starting to see the AAII investor sentiment index showing exuberance. In the past week, the percentage of bulls increased 6.5% to 44.1% which is 6.1% above the long term average. The percentage of bears fell 5.6% to 20.5% which is 10 points below average. The percentage of bears is better at predicting returns, so this is a bit concerning.
More evidence that the swimming pool has gotten pretty crowded: NAAIM Exposure Index at highest level since mid-2018; even most bearish respondent is net long; and by the first quartile, exposure is already up to 94% (highest since December 2017). pic.twitter.com/Z8OQPMvTYB
— Willie Delwiche, CMT, CFA (@WillieDelwiche) December 19, 2019
The NAAIM exposure index is probably giving off the direst warning. As you can see from the table above, the most bearish investor had a 13% long exposure to stocks. That’s the highest since April. The average exposure to the market is 98.9% which is the highest since June. The most stunning reading is the first quartile of investors have a 94.38% long exposure to stocks. The 1st quartile is the most bearish segment. That’s the highest long exposure since December 2017. If you want to see when the market is oversold, look at the exposure of the top quartile.
Jobless Claims Start To Normalize
In the previous report, jobless claims spiked, but it wasn’t a relevant data point because that week had the highest standard deviation of any week in the year. In other words, the holiday season distorted the reading. It had risen 49,000 to 252,000. Naturally, in the week of December 14th, jobless claims fell 18,000 to 234,000. That was above estimates for 221,000. The 4 week moving average only rose 1,500 to 225,500 because claims were very low in the prior 2 weeks to this spike. The chart below aims to adjust for this holiday impact. By seasonally adjusting the data to the 10 year average relative to the Thanksgiving week, claims are lower. There’s no issue here.
To account for the very late Thanksgiving holiday, we re-adjusted the seasonality of claims data which still shows a bit of a spike in November but not the same plunge then surge in the standard data.
Read more in tonight's Closer: https://t.co/TLgjNYPRas pic.twitter.com/6OU2cLw3lF— Bespoke (@bespokeinvest) December 19, 2019
Leading Index Gives Recession Warning?
The November leading indicators index’s yearly growth rate of 9 basis points was the lowest of the expansion. It’s usually a recessionary warning when it goes negative, although, if it does in the near future or in this report through a revision, it probably won’t be correct. Specifically, monthly growth was 0% which followed a decline of 0.2%. This report ended a 4 month decline. However, it missed estimates by a tenth.
The index was hurt the most by the ISM manufacturing new orders index which fell 1.9 points to 47.2. Negativity should be tempered because the ISM manufacturing PMI has been more negative than the regional Fed indexes and the Markit PMI. On the other hand, the flash Markit manufacturing PMI and output index as well as the Empire Fed, Philly Fed, and Kansas City manufacturing reports have all fallen in December. Countering that point is the Markit manufacturing PMI only fell a tick and the Philly Fed new orders index rose.
Even with the declines in the first two regional Fed indexes (Empire & Philly), the average expects the ISM PMI to rise to 51 from 48.1. The biggest help to the leading indicators index in November was the stock market. As we mentioned earlier, stocks are overbought which means they have had great returns in December. Stocks will probably help the leading index again. Jobless claims could be a negative. The because the spike was due to seasonality, it doesn’t mean much for macro, but it hurts the leading indicators index.
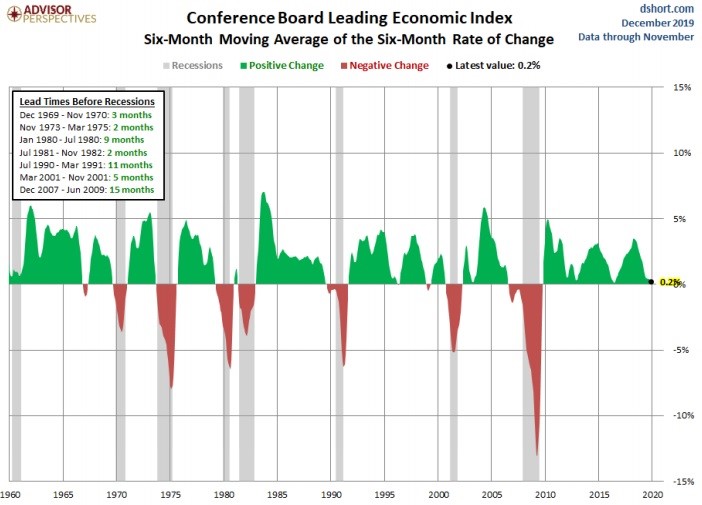
The 6 month average of the leading index was down 0.2% which is worse than the previous 6 month which saw a 0.3% increase. There were slightly more positive than negatives in the recent 6 months. The current indicators index had 0.9% growth which was up from 0.6%. The November ECRI coincident index had 1.8% growth which was the same as the previous month. It might be bottoming. In the week of December 13th, the weekly leading ECRI index was up 2.2% yearly. As you can see from the chart below, the 6 month moving average of the 6 month rate of change of the leading economic index was up just 0.2%. Negative readings lead recessions by 2-15 months. There have been 2 false recession readings.
Conclusion
Stocks have gotten overbought according to many metrics. That could lead to volatility in the start of 2020. It doesn’t help that they are also more expensive than average. This isn’t a bubble, but stocks aren’t likely to match 2019’s returns next year. Jobless claims fell as expected. The leading indicators index is almost signaling a recession, but that will reverse itself if the ISM manufacturing index rebounds in 2020 like it should. It was more negative than the other manufacturing sector reports in November. However, recent December metrics have had a sequential decline.