
This past Tuesday, I wrote “A Sellable Rally” in which I laid out the 4-reasons for a rally based on the psychological, fundamental, technical, and seasonal underpinnings. That rally came to fruition over the last few days.
For us, it has been the technical backdrop which remains the most compelling. To wit:
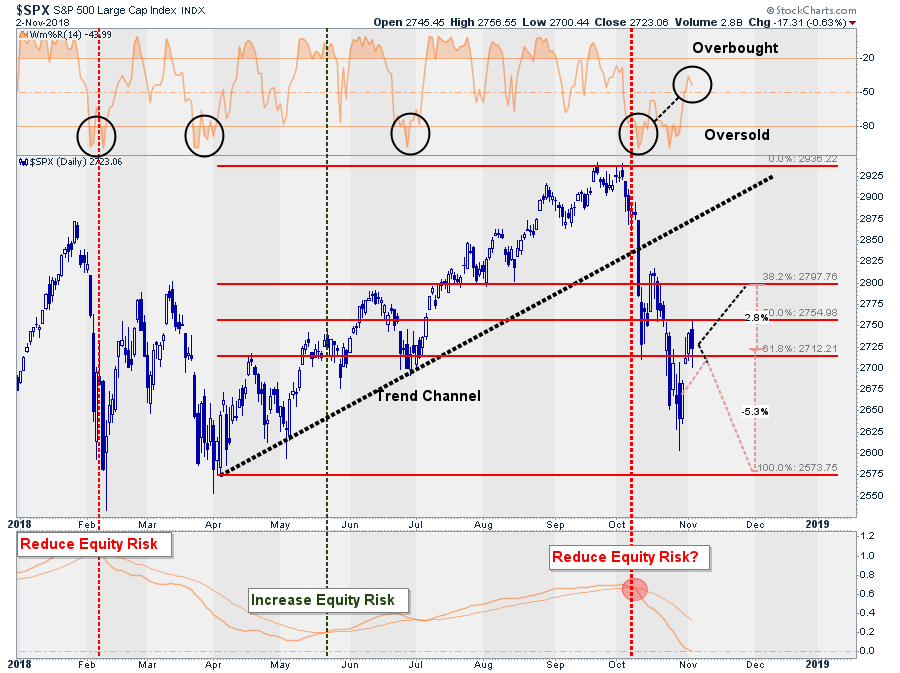
“Unlike the February lows, the recent sell-off fell 4-standard deviations below the 50-dma which is a rare event historically speaking. Such deviations do not last long as such an extreme move away from the average price tend to be corrected in fairly short order.“
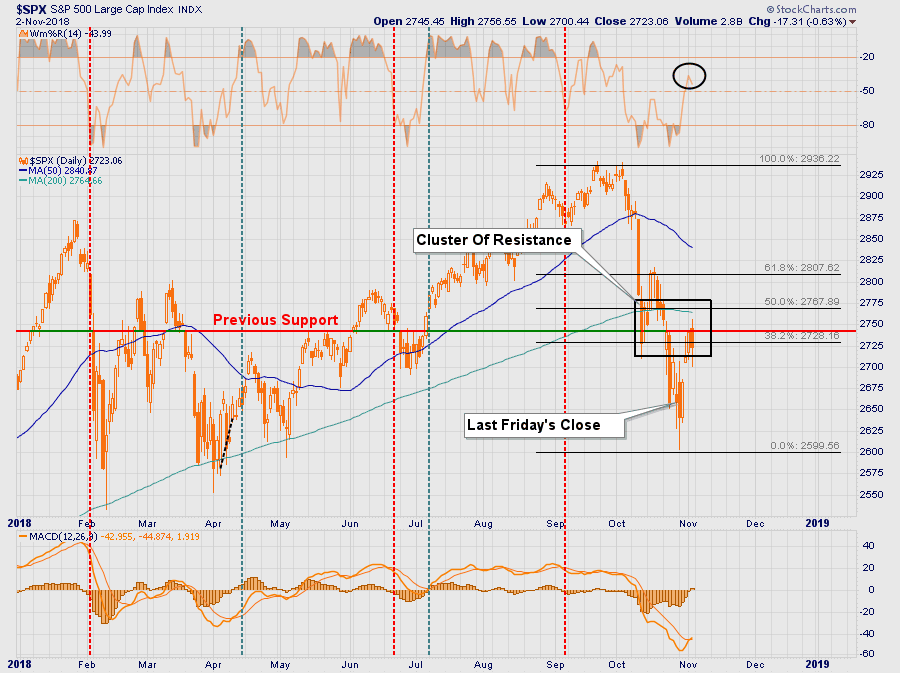
As shown, the combination of both the extreme oversold and deviated conditions contributed to a bounce which hit our “target neighborhood” of 2740-2750 on Friday morning.
In accordance with our portfolio management strategy, when the markets reached our target zone yesterday morning we executed sells of positions that have been under-performing both the market and other holdings within our portfolios. As we have stated many times previously, one of the primary tenants of portfolio management is to “sell losers.”
“Only losers, add to losers.” – Paul Tudor Jones
With portfolios reduced to 50% equity, we have a bit of breathing room to watch the elections next week. There is more than a decent chance the currently Republican controlled House of Representatives switches to Democratic control which would likely lead to further market volatility. However, Kevin Giddis from Raymond James laid out three likely scenarios last week.
“What could a potential change do for bonds and stocks? There are many possible scenarios, so the devil is in the details. I will lay out a couple of them for you:
1) The Republicans could lose the House, or the House and Senate. Either of these possibilities could derail the President’s agenda, leading us back to a period of gridlock that has plagued this country in the past. This would likely be good for bond prices and bad for equity prices.
2) The Republican majority remains intact, and the President pushes forward his plans of another tax cut, among other items as well. This would likely be good for stocks and bad for bond prices.
3) A complete rout that not only gives the majority of both the House and the Senate, it gives them the power and the votes to take on the President. If this happens, bonds could rally in price, the economy could lose its momentum, and the Fed would likely alter its monetary policy.
In the end, however this turns out, the markets are likely poised for some big changes come next Wednesday.”
He is right. More importantly, there are simply too many possible outcomes to head into the election without some extra cash on hand. That cash will either act as a hedge against a decline or will provide liquidity to add some discounted equity exposure where needed.
On a more bullish note, once we get past the election next week, we do start to deal with the “seasonal” bias that comes with the end of the year. As Stocktraders Almanac noted last week:
“This past midterm-year October that ended yesterday finished well below expectations and historical averages. DJIA declined 5.1%, S&P 500 dropped 6.9% and NASDAQ was off 9.2%. October’s losses were the seventh worst decline for DJIA since 1950, fourth worst for S&P 500 and fifth worst for NASDAQ since 1971. Historically, November and December market performance did hold up following a negative October.”
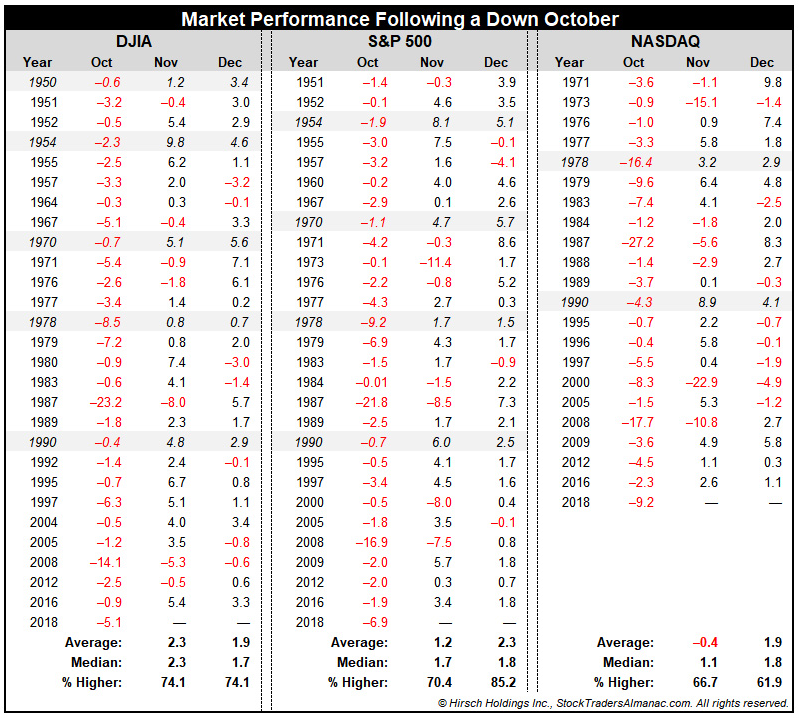
“The S&P 500 in November had a modestly weaker average performance following a down October, but December was notably stronger.”
Importantly, it should be noted that while the markets do tend to improve in November and December, following the 7% decline in October, an average gain of 3-3.5% does not get you back to even.
It is this seasonally positive bias that keeps us from a more restrictive equity allocation currently. However, it is our intention to use seasonal strength to reposition portfolios for a much weaker market environment going into 2019 as the bull market officially comes to its end.
Daily View
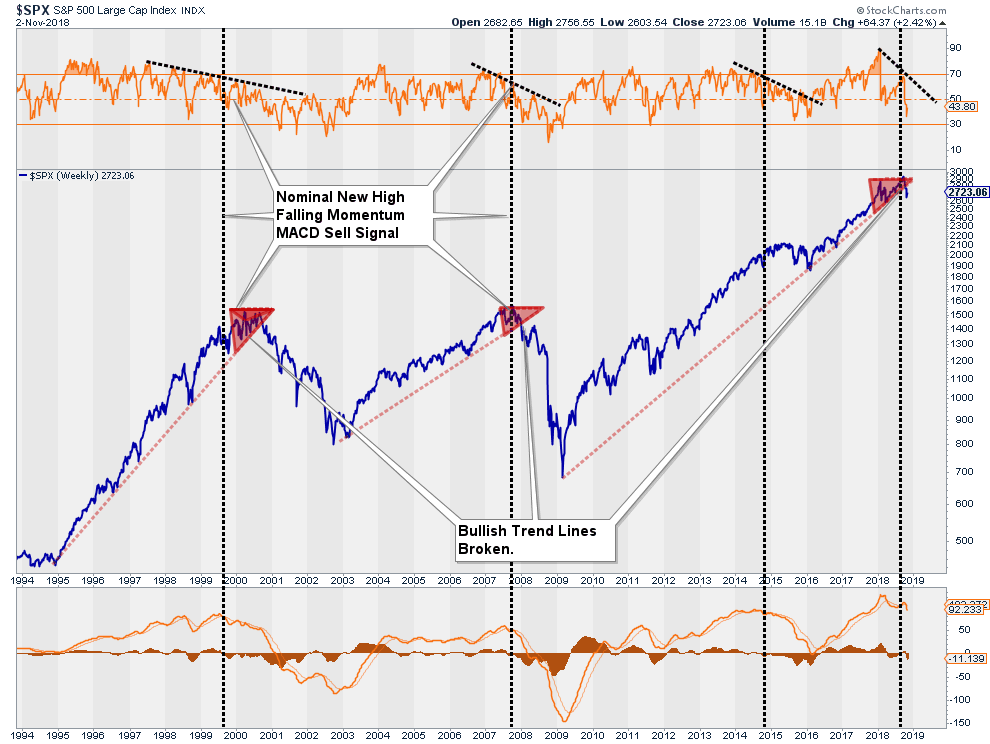
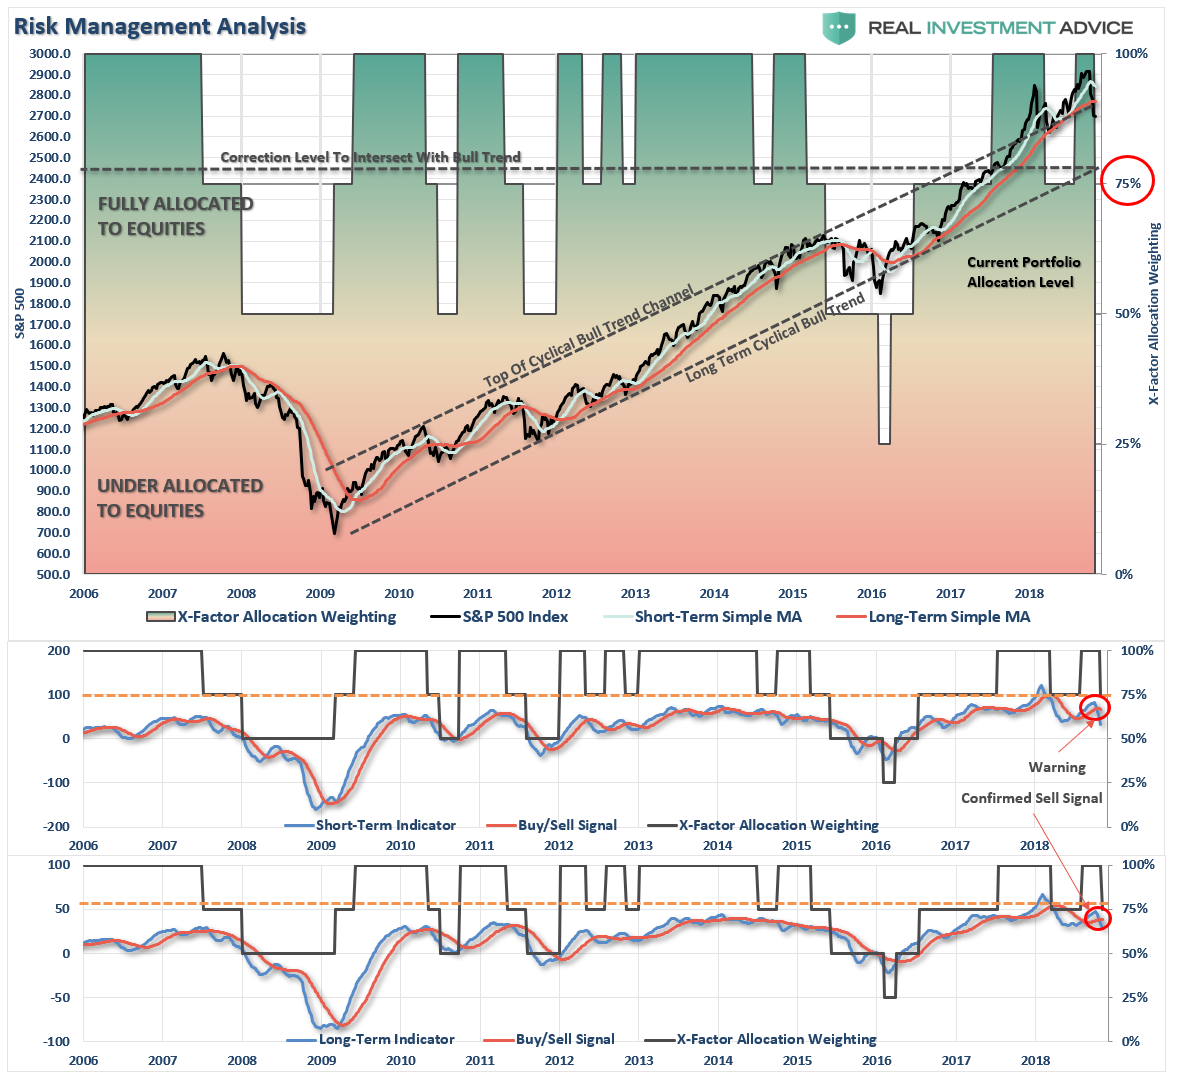
After violations of several important levels of support last month, the market did manage a rally back to the 50% retracement level from the April lows. The failure at the level confirms the ongoing bearish trend for now and keeps asset allocations on “high alert.”
I have updated the chart from last week with the previously suggested rally lines shaded light red. The black lines are the new projections based on Friday’s close. Currently, there is roughly 2.8% of upside, which is consistent with the seasonal trends as noted above, versus 5.3% of downside risk into December.
Action: After reducing exposure in portfolios last week, we will look for opportunities to reduce risk further as needed. Sell weak positions into any market strength on Monday.
Weekly View
As noted last week, with the trend line from the 2016 lows now violated, the tenor of the market has changed from bullish to bearish.
The failure of the market to break out of the current trading range this past week sets investors up for disappointment next week. It is critically important the market does not violate the trading range lows on a weekly closing basis.
Action: Sell weak positions into any strength on Monday and reduce exposure ahead of the election.
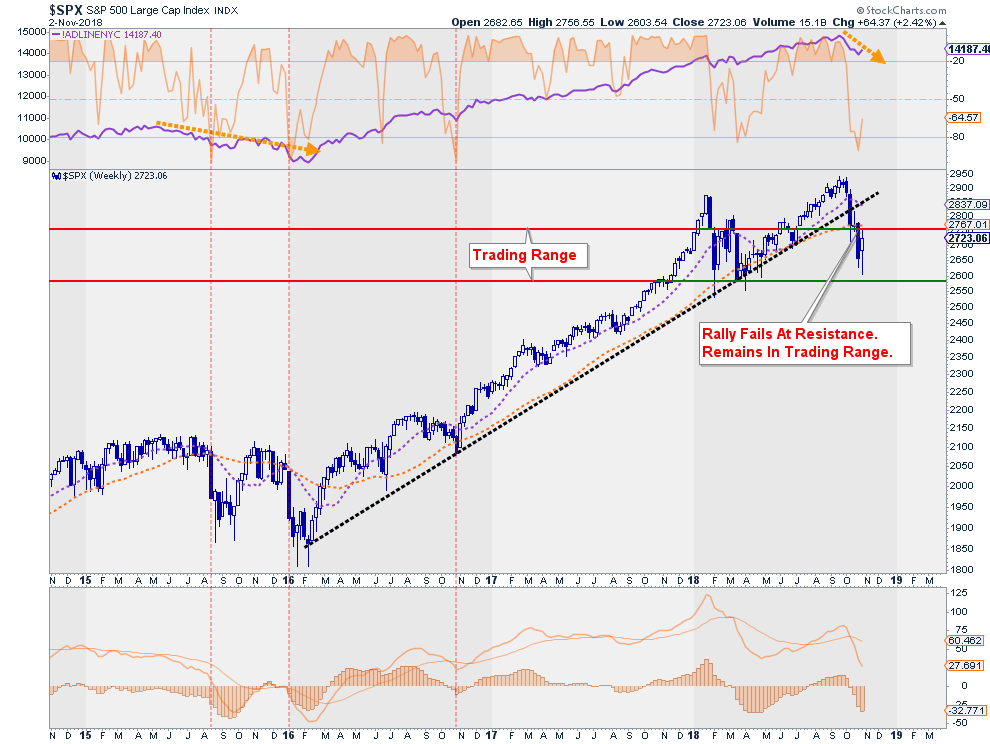
Of much greater concern in the violation of the long-term trend line combined with declining relative strength and a weekly “sell signal” triggered at a high level. As noted the prior two times all three of these indications have coincided it marked the end of the bull market cycle.
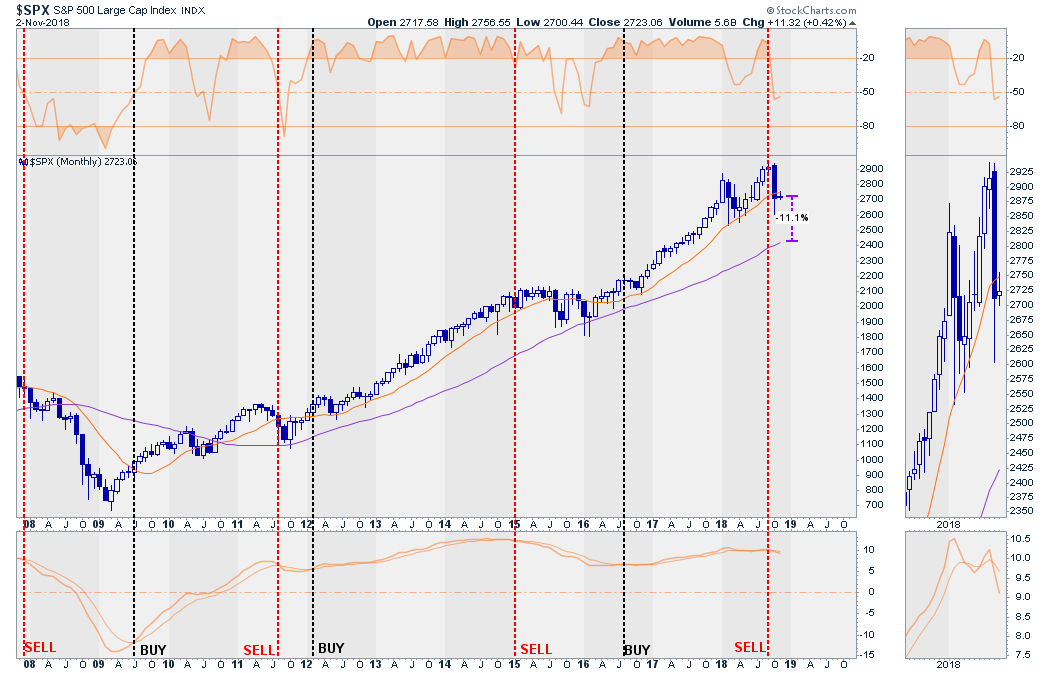
Monthly View
On a monthly basis, the backdrop has also worsened. RSI has dropped into correction territory along with a confirmed monthly sell signal. As I noted back in both December and September, extensions of the market that move 3-standard deviations above the long-term mean are unsustainable. Currently, a reversion back to the longer-term monthly average would entail a drop currently to 2400 or 11% lower than where we closed on Friday.
Action: Reduce risk on rallies, as detailed above, and look to add hedges on any breaks of long-term support
Actions To Take Next Week
As I stated last week:
“With the market exceeding 3-standard deviations below the 50-dma currently, the extreme oversold condition still sets the market up for a fairly strong bounce. That bounce SHOULD be sold into.”
Portfolio management processes have now been switched from “buying dips” to “selling rallies” until the technical backdrop changes.
Last week we:
- Reduced overall portfolio exposures to 50/50 from 60/40. Allocations will be reduced further upon increased technical deterioration.
- Rebalanced bond exposures and reduced risk. We improved credit quality and are positioning for economic weakness and lower yields by managing durations. (Read:The Upcoming Bond Bull Market)
- Raised cash levels to 10%. (Cash is a risk-free portfolio hedge)
- Reviewed all positions We sold several positions which were under-perfoming the broader market to reduce portfolio drag.
- Planed for further hedges to portfolios (Short term treasuries, cash, and short positions on breaks of support)
- Drastically tightened up stop losses. (We had previously given stop losses a bit of leeway as long as the bull market trend was intact. Such is no longer the case.)
We will continue to monitor the markets and adjust portfolio exposures accordingly.
See you next week.
Market & Sector Analysis
Data Analysis Of The Market & Sectors For Traders
S&P 500 Tear Sheet
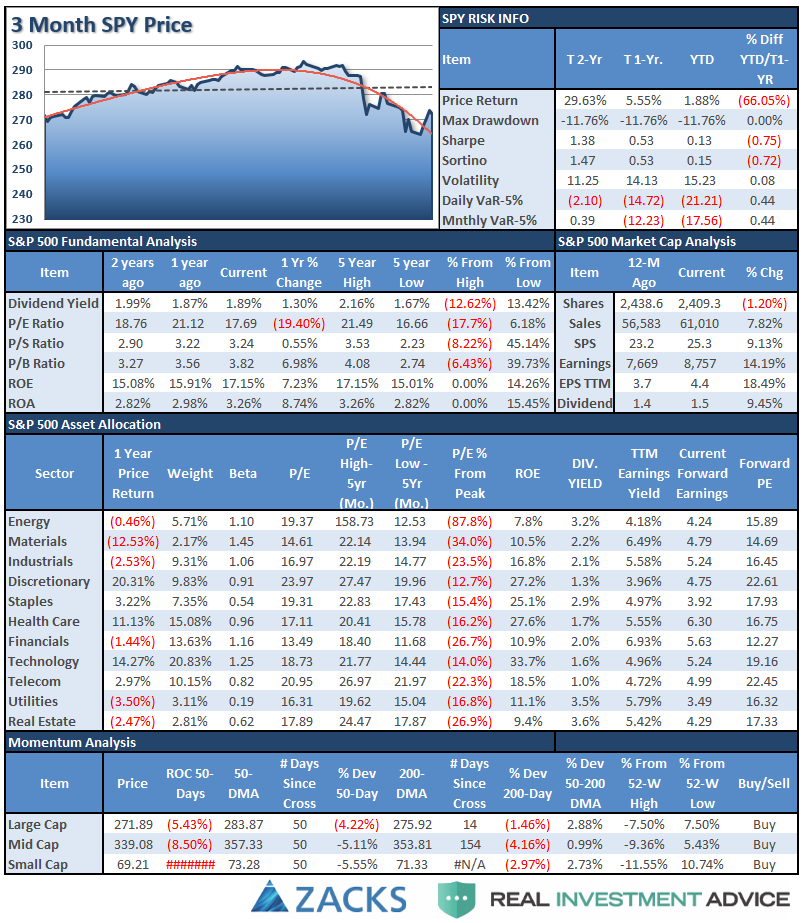
Performance Analysis
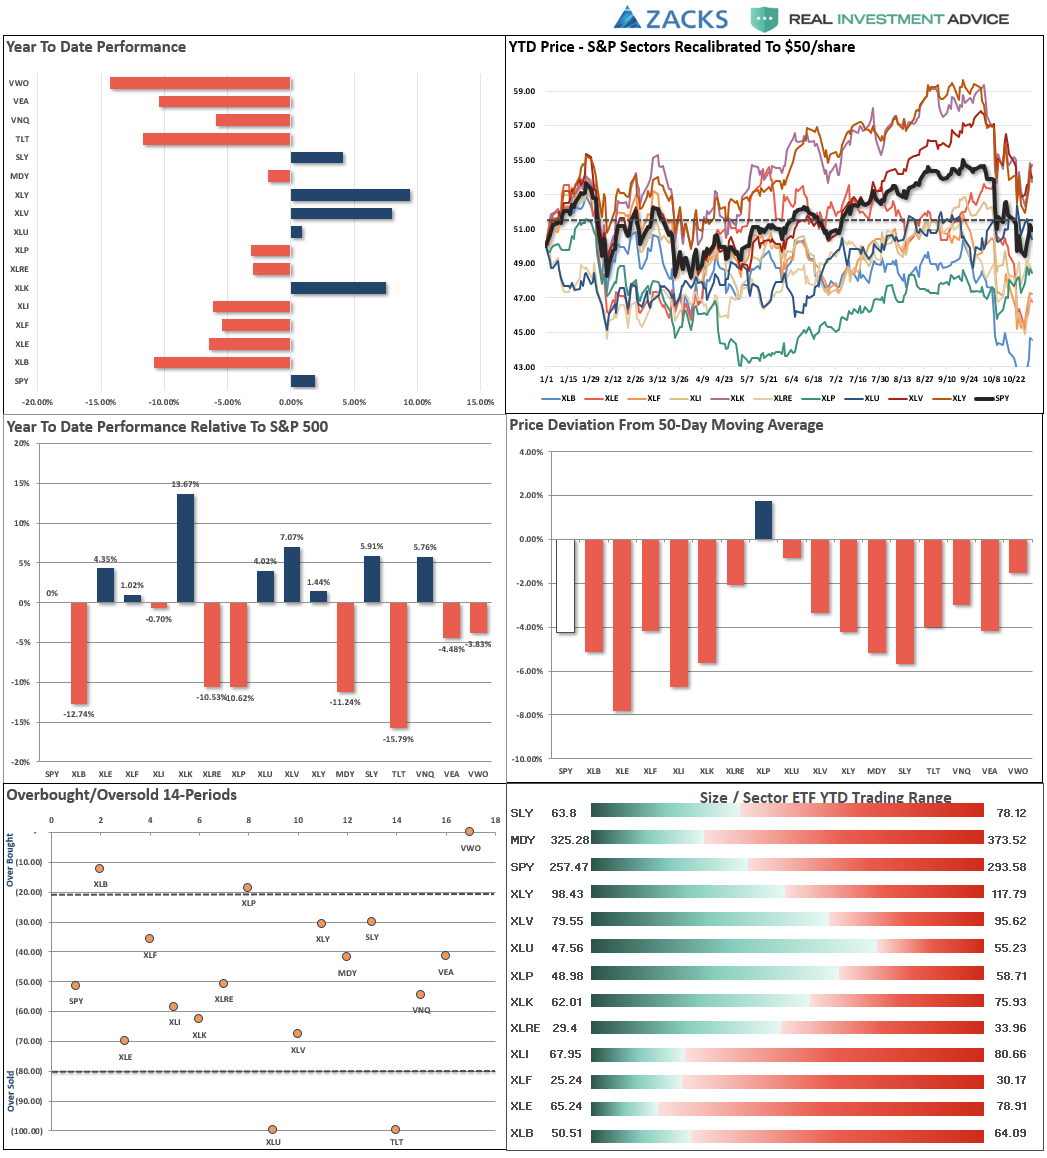
ETF Model Relative Performance Analysis

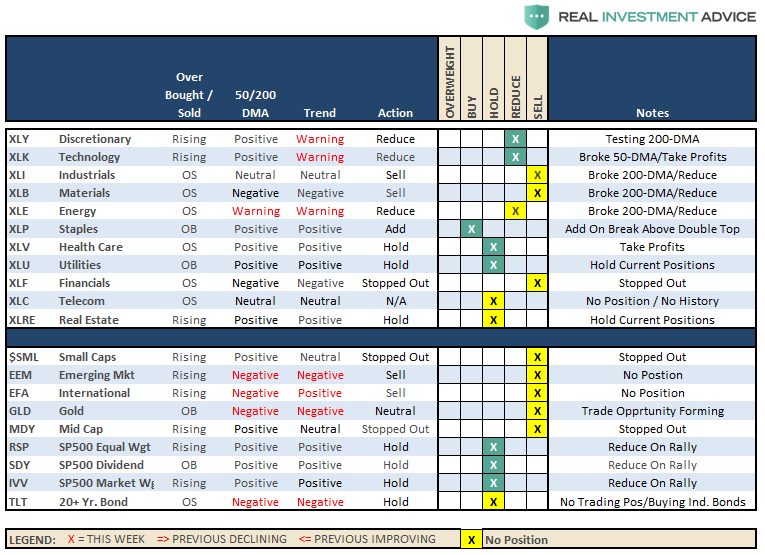
Sector & Market Analysis:
Sector-by-Sector
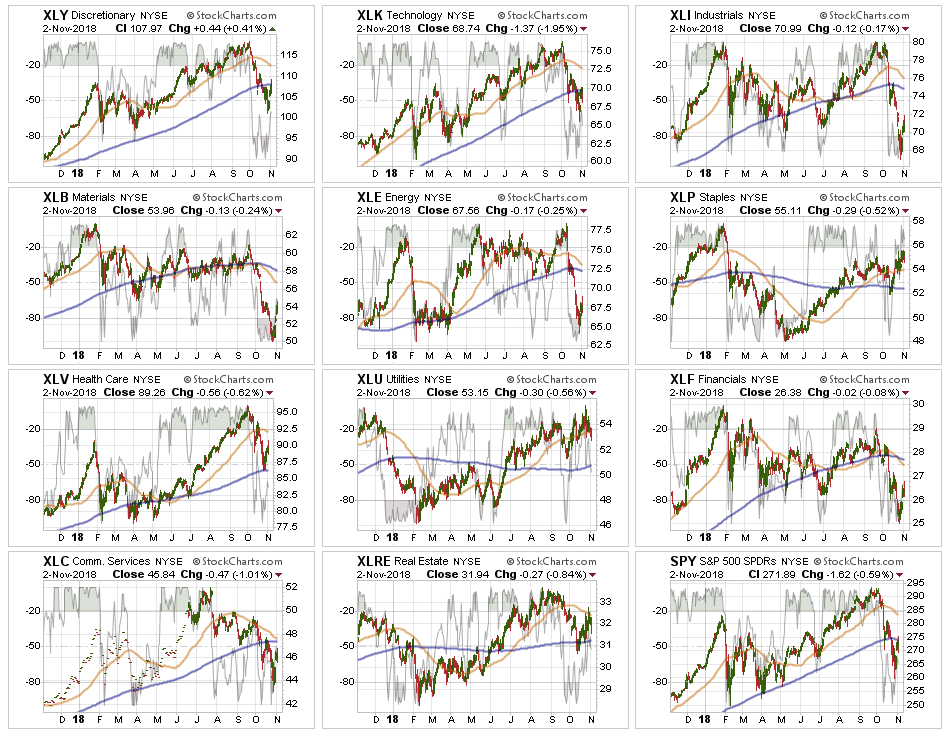
Discretionary and Healthcare last week the discretionary sector broke back above the 200-dma in a fairly strong rally. The sell off on Friday has the sector sitting on support so a rally next week is critical to keep this sector in a more bullish position. Healthcare, after a pullback to the 200-dma bounced nicely with the market last week. We remain slightly overweight these two sectors in portfolios currently.
Technology rallied back to and failed at the 200-dma as Apple (AAPL) weighed on the sector on Friday. After having taken profits previously in this sector, we have moved stops up to recent lows. It is critical the sector moves back above the 200-dma or lower lows will be likely.
Industrials, Materials, Energy, Financials, Communications – we sold Financials on the rally on Friday as stops were previously violated and the recent rally gave us a better opportunity to exit the position. We continue to maintain no excess exposure to Industrials, Materials, and Energy which continue to under perform the broader market.
Real Estate, Staples, and Utilities have held their ground during the rough month of October. If the recent rally in the market continues post-election look for a pullback in these sectors to support. We will look to increase allocations in Staples and Utilities on opportunity. While Real Estate has caught some flows in the “risk off” rotation, remain careful as the “actual” real estate market is under a lot of pressure from higher rates. This will eventually filter through to REIT’s.
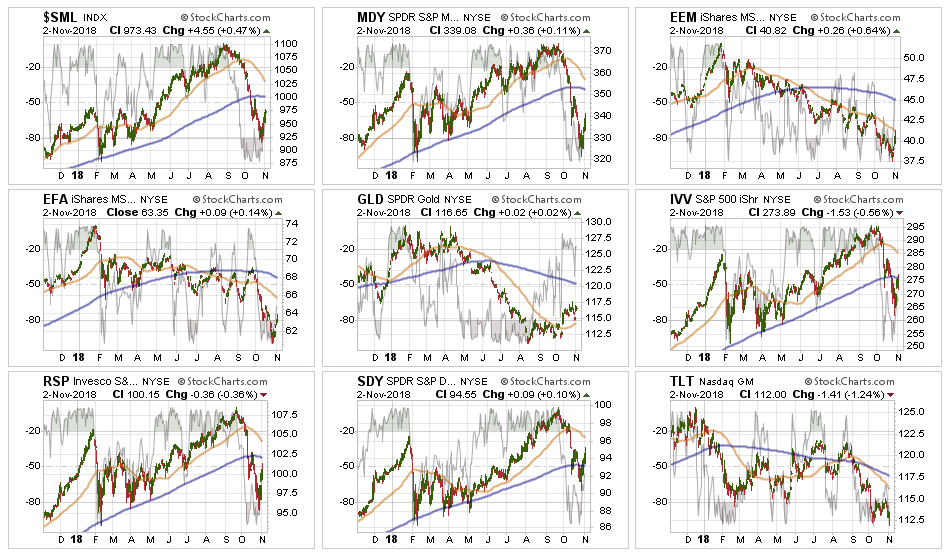
Small-Cap and Mid Cap – indices rallied a bit this past week and are quickly headed back into overbought territory. Use rallies to reduce risk in these markets for now until a better entry point presents itself. The damage to small and mid-cap markets is indicative of a weakening economic backdrop.
Emerging and International Markets rallied last week a bit after hitting new lows. There is still no compelling reason to add these markets to portfolios at this time.
Dividends, Market, and Equal Weight – The overall market dynamic has changed for the negative in recent weeks. Currently Dividends are outperforming Equal and Market Weight indices as the chase for yield and safety has weighed on more aggressive sectors of the market. Use the recent rally to reduce overall equity risk for now.
Gold – has started to build a bit of a bullish case. After finally breaking above the 50-dma, last week’s rally saw gold sell off back to support and hold. The bounce on Friday is encouraging. We will want to see gold break above $117 with some conviction before considering a trade. However the risk/reward isn’t great. Currently, there isn’t a lot of upside as the 200-dma sits at $120. Stops remain at $111. (Risk: $6 Reward $3)
Bonds – The rally over the last couple of weeks fell apart last week as bonds sold off as money rotated back to the“risk” trade. We have continued to use opportunity to shore up duration risk, rebalance models, and increase quality. Currently, all trading positions are currently closed.
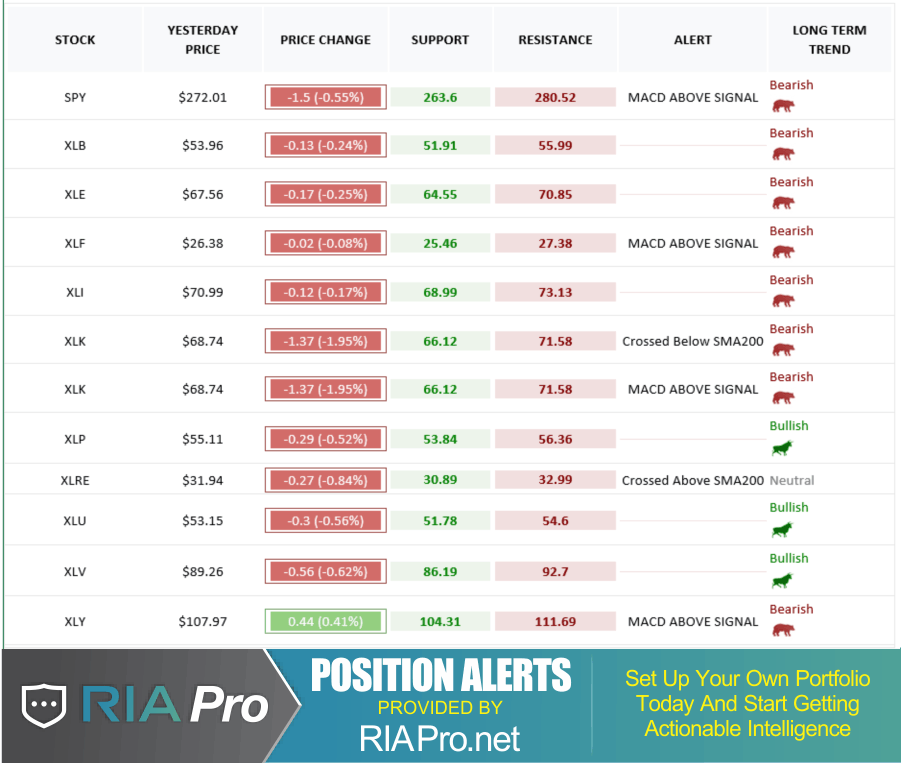
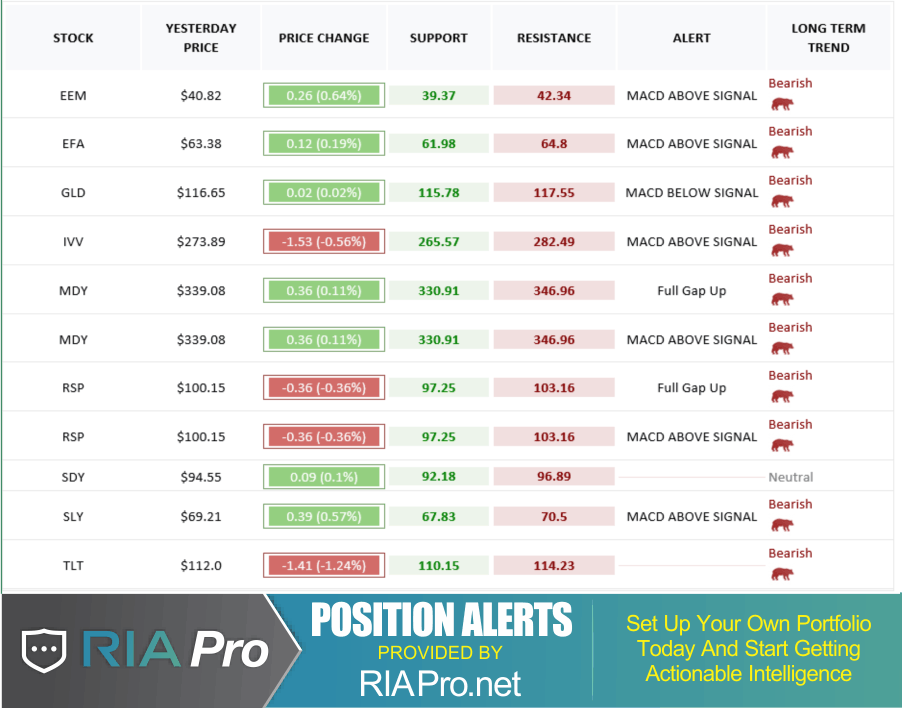
The table below shows thoughts on specific actions related to the current market environment.
(These are not recommendations or solicitations to take any action. This is for informational purposes only related to market extremes and contrarian positioning within portfolios. Use at your own risk and peril.)
Portfolio/Client Update:
The rally we were wanting to use to reduce risk occurred last week. That rally peaked at our target zone of 2740-2750 on Friday morning and we used that moment to raise some cash. This turned out to be a timely execution as the market then turned lower, and negative, throughout the rest of the day on Friday. The market action remains troubling and with the mid-term elections on Tuesday we are more comfortable holding some cash until that risk passes.
The market remains oversold on a short-term basis. That oversold condition combined with the seasonal “winds” at our back, we will look for continued rallies to reduce risk and rebalance into.
Please review the “Checklist Of Actions To Taken” in the main missive above. We will continue to apply these guidelines to our portfolios over the next couple of weeks. We took the following actions on Friday:
- New clients: We continue to HOLD OFF the on-boarding process into our portfolio models until a better risk/reward opportunity emerges.
- Equity Model: We sold several laggards on Friday including SU, KLAC, JPM, and HD. We have a couple of more holdings on the “chopping block” if performance doesn’t improve soon.
- Equity/ETF blended – Same as with the equity model. Small and Mid-Caps were sold previously on stop-loss violations.
- ETF Model: Small and Mid-cap holdings were previously sold on absolute stop violations. Friday we sold XLF after a stop-loss violation.
As noted previously, the violations of the market “this time” are markedly different than what we have seen previously. However, we do NOT want to panic if this is indeed just a correction within an ongoing bullish trend. The market HAS NOT violated the lows of February and earnings growth (while disappointing) is still growing. The pick up in volatility is certainly not enjoyable, but we don’t want to let our emotions get the better of our discipline.
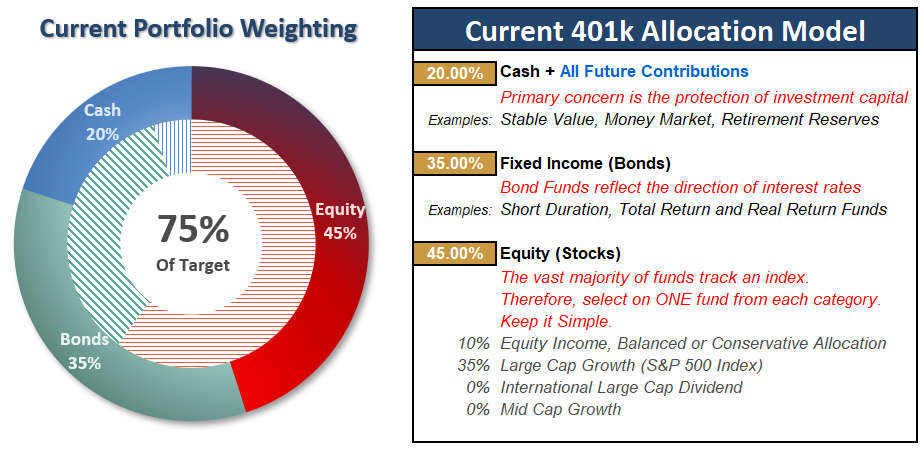
THE REAL 401k PLAN MANAGER
The Real 401k Plan Manager – A Conservative Strategy For Long-Term Investors
There are 4-steps to allocation changes based on 25% reduction increments. As noted in the chart above a 100% allocation level is equal to 60% stocks. I never advocate being 100% out of the market as it is far too difficult to reverse course when the market changes from a negative to a positive trend. Emotions keep us from taking the correct action.

Starting To Reduce Exposure To Reduced Target Levels
Last week we got the rally we have been looking for to raise some cash into.
This week, I have lowered the allocation model to 75% of target.
HOWEVER, this does NOT mean immediately go out and sell 25% of your holdings. The model moves in 25% increments as signals are triggered. However, by the time a signal is triggered, the market tends to be very oversold which is why we wait for a bounce to opportunistically sell into.
As noted throughout the main body of the newsletter, we did reduce equity risk in portfolios by 10% this past week. As long as the market remains in a more negative trend we will continue to use rallies to reduce equity further until we get to the 25% target.
With BOTH of our primary SELL SIGNALS in place, we do need to adjust the model lower. Continue to use rallies to reduce risk towards a target level with which you are comfortable. Remember, this model is not ABSOLUTE – it is just a guide to follow.
Defense remains our primary strategy for 401k-plans currently.
- If you are overweight equities – reduce international, emerging market, mid, and small-capitalization funds on any rally next week. Reduce overall portfolio weights to 90% of your selected allocation target.
- If you are underweight equities – reduce international, emerging market, mid, and small-capitalization funds on any rally next week but hold everything else for now.
- If you are at target equity allocations reduce overall equity exposure to 90% of your allocation target on any rally Monday.
Unfortunately, 401k plans don’t offer a lot of flexibility and have trading restrictions in many cases. Therefore, we have to minimize our movement and try and make sure we are catching major turning points. Over the next couple of weeks, we will know for certain as to whether more changes need to be done to allocations as we head into the end of the year.
If you need help after reading the alert; don’t hesitate to contact me.
Current 401-k Allocation Model
The 401k plan allocation plan below follows the K.I.S.S. principle. By keeping the allocation extremely simplified it allows for better control of the allocation and a closer tracking to the benchmark objective over time. (If you want to make it more complicated you can, however, statistics show that simply adding more funds does not increase performance to any great degree.)
401k Choice Matching List
The list below shows sample 401k plan funds for each major category. In reality, the majority of funds all track their indices fairly closely. Therefore, if you don’t see your exact fund listed, look for a fund that is similar in nature.
