Turmoil in the housing market and its impact on the “median price.”
By Wolf Richter for WOLF STREET.
Across the US, despite record low mortgage rates, sales of “existing homes” – closed transactions of previously owned single-family houses, townhouses, condos, and co-ops – plunged 17.8% in April from March, after having already plunged 8.5% in March from February, to a seasonally adjusted annual rate of 4.33 million homes, last seen in September 2011 (also 4.33 million). The last time sales were lower was in July 2010. This knocked April’s sales volume down by 25% from pre-Covid February (data via YCharts):
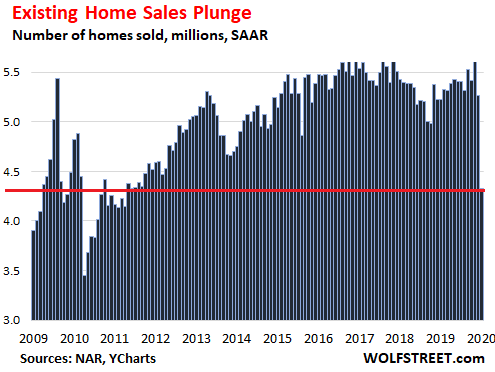
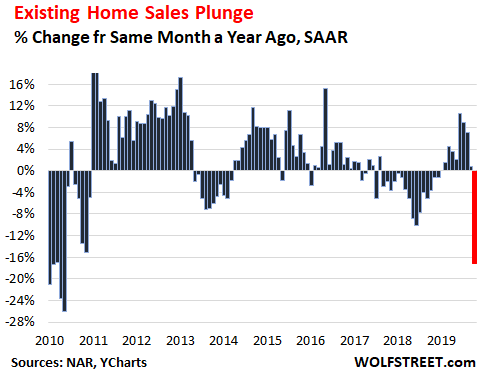
Compared to April 2019, homes sales dropped 17.2%, according to the National Association of Realtors today. It was the sharpest year-over-year drop since August 2010, during the Housing Bust (data via YCharts):
But condo sales were hit much harder than house sales – and that’s crucial for the discussion of the median-price head-fake in a moment:
- Sales of single-family houses dropped by 15.5% year-over-year, to 3.94 million units seasonally adjusted annual rate.
- But sales of condos collapsed by 31.6% year-over-year to 390,000 seasonally adjusted annual rate.
The “Change in Mix” causes the median price to do a head-fake.
“Changes in the composition of sales can distort median price data,” the NAR cautions in its footnote #3.
This is not normally a huge issue unless the market goes into turmoil when sales volume plunges and the bottom is falling out of the low end, because tens of millions of people have lost their jobs, and lending standards have tightened up for riskier mortgages, which is now.
We’re seeing evidence in the NAR report that the bottom is falling out at the lower end: the 31.4% collapse in condo sales. We’ll get to that in a moment.
First, the median price jumped 7.4% to $286,800, which would be astonishing, given the turmoil in the market and the unemployment crisis, but this being a median price, it’s not astonishing; it’s expected:
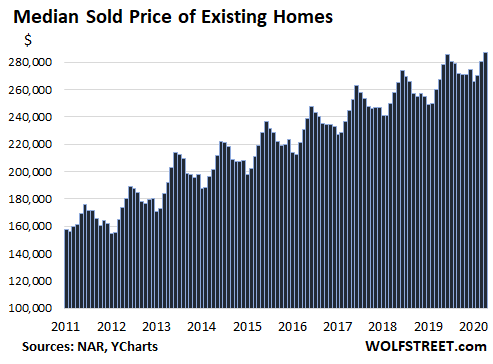
The median price is the price in the middle, where half the homes sell for more and half the homes sell for less. The median price metric can be distorted by the price-mix of the homes that have sold, as the NAR points out in its footnote #3.
When sales at the lower half of the spectrum plunge while the upper half is hanging on better, then this changes the price-mix of homes that have sold, with a relatively smaller number of lower-priced homes in the mix, and a relatively larger number of higher-priced homes in the mix. This change in mix pushes up the median price of all homes sold, though actual prices of individual homes may have gone into other directions.
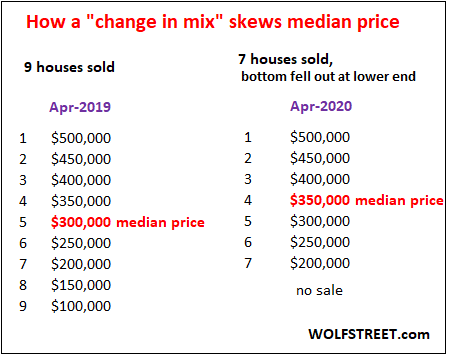
How a “change in mix” skews the median price:
The table below shows a very simple housing market. In April 2019, 9 houses sold, with a median price of $300,000. In April 2020, the same top 7 houses sold again, each at the same price as a year ago, but the two lowest-priced houses didn’t sell. So actual house prices did not change at all. But the median price jumped because the mix changed:
That a median price index can be heavily skewed by changes in the mix is its primary disadvantage. That’s why the Case-Shiller Home Price Index uses “sales pairs,” comparing prices of the same home over time, multiplied by thousands of homes in each market. The Case-Shiller index essentially delineates how the price of the same home changes over time. It is not impacted by mix.
But the Case-Shiller Index is a three-month rolling average released with a one-month lag. The last data set, released on April 28, was the average of sales prices that were entered into public records in December, January, and February – useless for the Covid-19 market.
So we’re stuck with the median price index for now. But we need to understand that changes in mix skew the median price away from actual changes in home prices.
And this is what happened in April.
Condo sales plunged 31.6% year-over-year, more than twice the decline of house sales (-15.5%). Condos generally are somewhat lower-priced than houses. The fact that condo sales plunged more than twice as much as house sales shows two things: One, the mix changed, resulting in a larger share of houses in the mix and a smaller share of condos; and two, it indicates that the lower half of the price scale is seeing relatively larger volume declines – both houses and condos – than the higher end.
This dynamic makes intuitive sense: Volume plunged as tens of millions of people have lost their jobs and are out of the housing market, and those that still have jobs but are not at the top of the income scale and have perhaps lower credit scores and need riskier mortgages to buy a home, well, they have problems getting approved for a mortgage because now riskier mortgages have become harder to come by, and because lenders are getting more skittish about lending on condos, which are perceived as riskier.
So when there is a drastic drop in volume accompanied by a drastic change in the price-mix of what sells, the median price is not a reliable indicator of how actual prices changed.