by Natura Naturans
(Updated Oct. 23, 2019) Retired Principal Scientific Officer (PSO) for the British Government exposes “discrepancies” in NASA’s Global Historical Climate Network (GHCN) which serve to make recent temperatures seem warmer.
The “mistakes” point to possible fraud intended to give scientific credence to tax-raising UK and US climate policies.
The unnamed source, now retired from the UK Scientific Civil Service and speaking exclusively to Principia Scientific International (PSI), was so disturbed by the “tampering” of government temperature records that he performed his own verification tests and exposed a shocking anomaly that turns the global warming narrative on its head.
The highly qualified whistleblower reveals that he downloaded the raw station data from NASA/GISS gridded land anomaly products and compared them with the anomalies.
He told PSI:
“Having processed NASA GISS 250km T2m and 1200Km T2m global land anomaly data products I also processed Global Historical Climate Network (GHCN) daily mean temperature records from the 1,045 stations that have been continuously operative since 1900.
“Since these 1,045 stations form the backbone of the historical world meteorological network, and therefore NASA GISS products, we may expect results to be largely similar, though with the inflated variance within the GHCN-D data series (GISS anomalies are highly processed products). Not addressed in this study is the urban heat island effect which is known to contaminate the land-based record.
“Prior to 1970 there is an inexplicable divergence in that NASA GISS products show historic global land temperatures to have been cooler than those recorded by the 1,045 GHCN-D stations; this difference is most pronounced around 1930 when extreme heatwaves were experienced across the continental US and in other parts of the world (a fact recorded in newspapers of the day).
“The extremes of the 1930s/40s down to the cooler 1960s/70s prompted scientific discussion of a pending ice age.”
The retired top government scientist laments that he is old enough to remember the wild media scaremongering of the 1970’s global cooling.
He spoke of how the very same scientists and government bodies that were warning of an impending Ice Age in the seventies are the very same tax-zealous advocates hyping global warming today.
At this stage, the evidence may support skeptic claims that governments have an agenda to promote climate scaremongering.
Unlike the seventies, the only difference this time is the narrative is all about global warming, not the threat of an imminent ice age.
Our insider source reveals that global land temperature anomalies estimated as high as 1.23°C today were actually occurring routinely as far back as 1934. These temperatures were only surpassed again in 2015.
https://climatechangedispatch.com/whistl…mate-data/
Tony Heller has done the same research and come to the same conclusion. But it is not confined to NASA, it is all the climate bureaus around the world. There trick is to adjust the older temperatures lower and boost the newer ones to make it look like there really is global warming.
https://realclimatescience.com/climate-s…-the-past/
99% of modern scientific papers are nothing more than politically-motivated pseudoscience, warns science pioneerM
“Truth” has a price tag
This is such a fascinating idea to consider; particularly as the base motivation for these “scientists” appear to be more focused on capitalism rather than accuracy. Armstrong argued that being politically convenient is more rewarding both financially and in terms of one’s career.”
http://www.fourwinds10.com/siterun_data/…1534349370
In 1986, NASA’s top climate scientist James Hansen predicted the US would heat up 4-6 degrees by 2020 (next year.)
And by 1999, Hansen’s US temperature data (left graph below) showed cooling since the 1940s.

This was very disturbing to both NASA and NOAA. Their CO2 warming theory was failing badly, so they simply changed the data, turning cooling into warming. This happened at the same time Michael Mann was erasing the Medieval Warm Period.
The blue line below shows the five year mean of the average annual temperature at all NOAA United States Historical Climatology Network Stations. The red line shows the graph they release to the public, which has been highly altered to create the appearance of warming – which does not exist in the thermometer data.
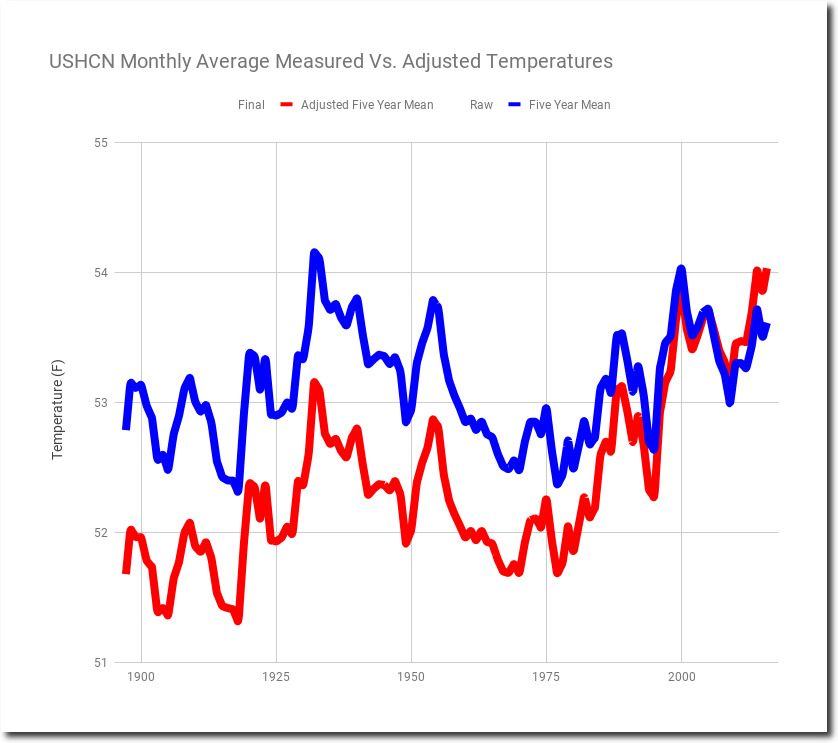
This is a comparison with the previous unadjusted temperature graph and the faked up graph NASA tries to pawn off as real.
https://realclimatescience.com/61-fake-data/