For about 1 in 4, Social Security provides at least 90 percent of their income.
How many retired workers are getting less than $1,000 per month in Social Security benefits? The question came up and I was curious enough to find the answer, and download the data into an Excel spreadsheet which I saved as a PDF that you can review here. Note that this data is for the 46.5 million retired workers only, and does not include benefits paid to survivors, spouses, disabled, etc.
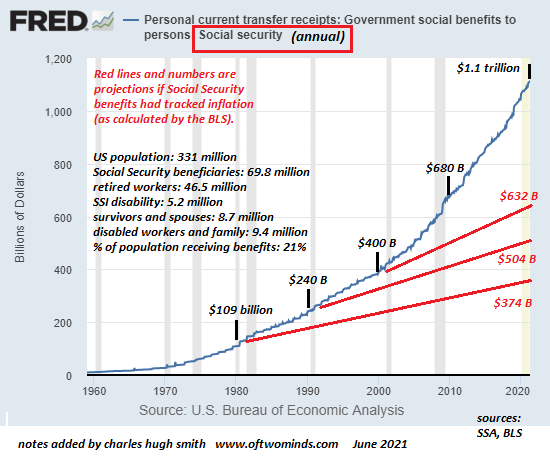
This led to a deep dive into the basic numbers of Social Security beneficiaries and expenses, which are summarized in the chart below. Here are the basics:
Population of the US: 331 million
Social Security beneficiaries: 69.8 million (21% of the population)
Retired workers: 46.5 million (14% of the population)
Survivors and spouses: 8.7 million
Disabled workers and families: 9.4 million
SSI disability: 5.2 million
Projected annual cost 2021: $1.1 trillion
It turns out that 23.4% of all retired workers receive less than $1,000 a month in Social Security (SSA) benefits. Note that $148.50 is deducted monthly from the SSA benefit for Medicare Part B for retirees age 65 and older, so the net cash received is $148.50 less than the full benefit for everyone in Medicare (age 65 and older).
Roughly half of all retired workers receive $1,500 or less per month.
76% of all retired workers receive less than $2,000 a month.
91% of all retired workers receive less than $2,500 a month.
98% of all retired workers receive less than $3,000 a month.
4,201 beneficiaries receive $4,000 or more per month.
For roughly half of the elderly, Social Security provides 50 percent of their income, and for about 1 in 4, it provides at least 90 percent of their income. The top 10% of senior households enjoy average incomes of about $230,000. Social Security Benefits Are Modest (Center on Budget and Policy Priorities)
In summary, few are living large on Social Security benefits.
The chart below depicts the accelerating costs of SSA retirement and disability benefits. As a guideline, I extended the SSA expenditures in 1980, 1990 and 2000 if the expenditures had tracked inflation, as calculated by the Bureau of Labor Statistics (BLS). Clearly, the programs’ costs are rising faster than inflation as the number of retirees and disabled expands.
You can find further data on these Social Security Administration pages:
Retired worker beneficiaries in current payment status at the end of December 2020
Social Security Administration Monthly Statistical Snapshot, April 2021
If you found value in this content, please join me in seeking solutions by becoming a $1/month patron of my work via patreon.com.
My new book is available! A Hacker’s Teleology: Sharing the Wealth of Our Shrinking Planet 20% and 15% discounts (Kindle $7, print $17, audiobook now available $17.46)
Read excerpts of the book for free (PDF).
The Story Behind the Book and the Introduction.
Recent Podcasts:
Charles Hugh Smith on the Era of Accelerating Expropriations (38 min) (FRA Roundtable Insight)