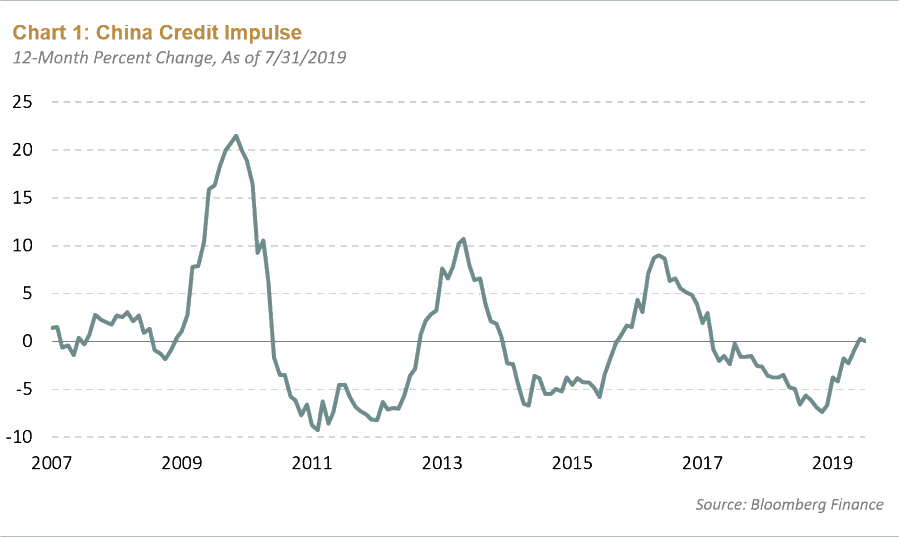
via Jimmy Su:
Consensus thinks that the China consumption story is driven by the “rising middle class” but as always the actual reason is much more complicated.
Also, BCA looks at the ratio relative to household income instead of GDP because the latter includes non-consumer related line items (I.e. govt spending, investment, net exports). Makes sense, in my view.
For those asking about saving rates, see link to Berg article. Looking at net debt to income might be meaningful, although having 80% of household wealth tied up in real estate is 😬.
Would be keen for anyone who’s looked at this in detail to weigh in.
https://bloomberg.com/opinion/articles/2018-07-08/chinese-savers-won-t-save-the-chinese-economy
Actually this story in the FT breaks down debt further. They measure debt to GDP instead of household income. Just eye balling the chart, non-mortgage debt has gone from MSD% to mid teens % of GDP.
https://ft.com/content/bb3166ea-8b1f-11e8-b18d-0181731a0340
https://brandywineglobal.com/aroundthecurve/index.cfm?page=article&content=577524209


