Just how overstated are new home sales?
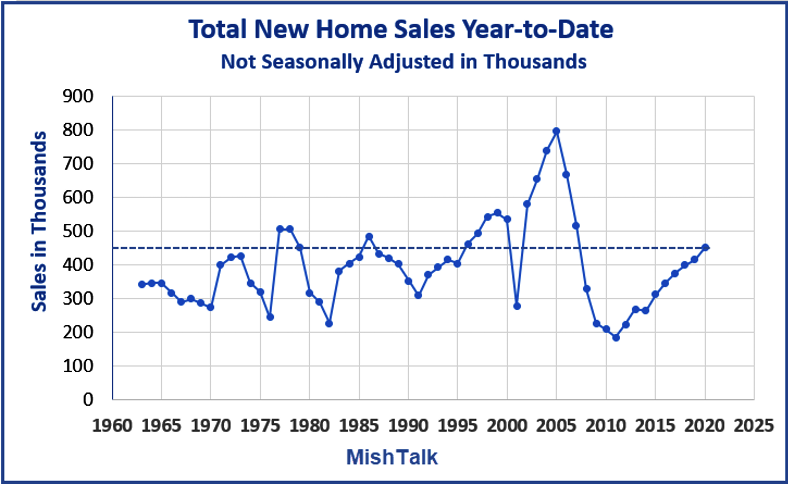
Year-to-date new home sales total 450,000. That is the 6th consecutive increase January through July.
Comparisons Gone Haywire
Seasonally adjusted annualized (SAAR), New Home Surged to a 13-Year High With the Midwest Leading the Way.
By Region Month-Over Month Percentages
- US: +13.9%
- Northeast: -23.1%
- Midwest: +58.8%
- South: +13.0%
- West: +7.8%
By Region Year-Over Year Percentages
- US: +36.3%
- Northeast: +25.0%
- Midwest: +81.4%
- South: +27.6%
- West: +40.8%
Covid-Skewed Numbers
Due to Covid-19, 2020 is not a normal year.
Strange things happen when you make seasonal adjustments and even year-over-year unadjusted comparisons in such setups.
Unadjusted Numbers
On an unadjusted basis there were 78,000 newly homes sold during July vs 75,000 in June.
Those 75,000 new home sales in July alone were reported as 901,000.
However, the year-to-date total for seven months is only 450,000.
What’s the Valid Comparison?
I downloaded the unadjusted new home sales data from Fred (the St. Louis Fed data repository) and totaled up the year-to-date numbers since 1963.
Year-to-date, there were 450,000 new homes sold. Last year, there were 415,000 homes sold through July.
The year-over-year gain is a more realistic 35,000 / 415,000 = 8.4% not 36.3%.
For those with money and a job, Covid helped. The Fed slashed interest rates and mortgage rates followed.
But problems brew beneath the surface.
Mortgage Lenders Ask New Question: Do You Intend to Pay?
Serious defaults are at a decade high and lenders are now have new forms.
For discussion, please see Mortgage Lenders Ask New Question: Do You Intend to Pay?