by Alexander Trigaux, Editor, GoldSilver
We casually refer to “the stock market” all the time. And whatever the Dow Jones, the S&P 500, and the Nasdaq are doing is generally accepted as how “the market” is doing.
But there are about 3,600 publicly traded stocks between then NYSE and the Nasdaq. Drilling deeper into market internals tells us what the market is really made of, the true structure and state of its underlying integrity, as opposed to the cursory snapshot that the indices provide.
So how well is a market really doing when three times as many stocks are trading at their lowest levels in a year as compared to those trading at 52-week highs?
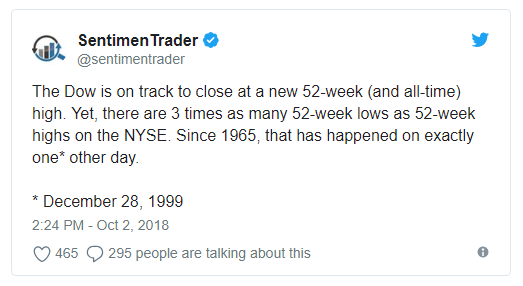
There have been two days since 1965 have seen 3x as many NYSE stocks at year-lows than at year-highs while the Dow traded at an all-time high.
The only other time prior to October 3, 2018?
December 28, 1999. The Dow was just days prior to hitting 11,722 on January 10, 2000, which would mark its long-term top. It would bottom at 8,062 on September 21, 2001. A 32% decline. The Nasdaq lost over 60% of its value during that same period, and would decline 78% from its all-time high.
And now this oddity has occurred again. And one of the major forces driving it is the massive rise in index investing:
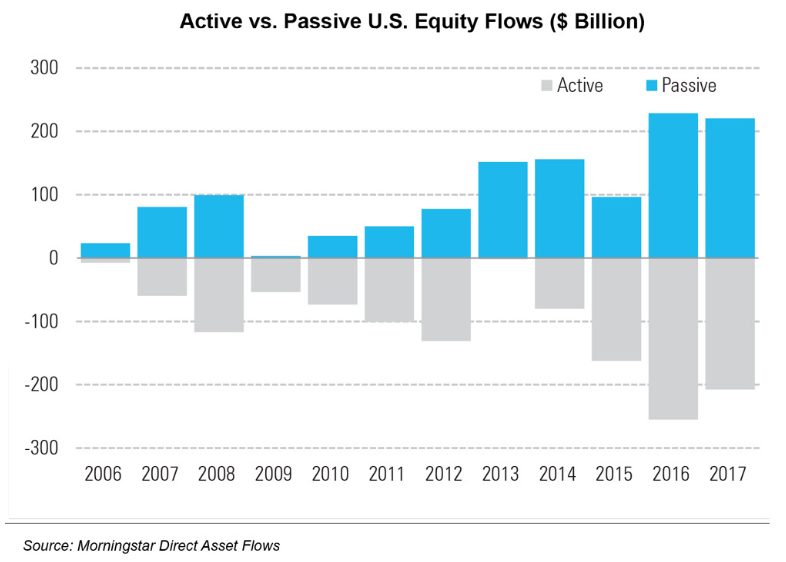
As investors started to realize that they were getting fleeced paying for active management of mutual funds that routinely underperformed super-low-fee index funds, there was a sea change in individual investor behavior, as seen in the above chart.
The mechanics of that are important. Take the huge inflows that have moved into S&P 500 Index funds. That means that 500 individual stocks have seen blind, persistent buying. And not a penny of those index fund inflows went to 3,100+ other publicly traded companies.
As of July, Amazon, Netflix, and Microsoft – three of 500 stocks – were responsible for 71% of the S&P 500’s annual gain.
The S&P has long been viewed as a way to gain balanced equity exposure across a wide array of market sectors and types of companies. But Apple, Microsoft, and Amazon – three of 500 stocks and all tech companies – comprise over 11% of the entire index’s weighting as of September 30, 2018:

So when you hear how “the market” is at record highs and how “the market” is doing so well, what people are really referring to is a narrow slice of the market as a whole. Fully three times as many companies that make up “the market” are at their lowest price levels of the past year vs. those that are at their highest.
Will the new Dow high in the face of so many NYSE 52-week lows serve as timely a predictor of market collapse as it did in 1999? Time will tell. If it does, a major inflection point is close at hand, and the days of bargain-basement gold and silver prices are numbered.