Wolf Richter wolfstreet.com, http://www.amazon.com/author/wolfrichter
With US auto sales facing some stiff headwinds, timely data is no longer wanted, said GM Monday night, when it announced that it would no longer report new-vehicle unit sales in the US on a monthly basis to make it “easier” for us. This has been bread-and-butter data of the auto industry. But forget it. Now it’s like so TMI. Sez GM:
Thirty days is not enough time to separate real sales trends from short-term fluctuations in a very dynamic, highly competitive market. Reporting sales quarterly better aligns with our business, and the quality of information will make it easier to see how the business is performing.
I’m glad GM is trying to make things “easier” for us. Tuesday morning was the last time GM released monthly deliveries. Other major manufacturers will eventually fall off the wagon too. Even if they continue to report monthly, the industry totals will not be known, with GM’s 17% share missing. The end of an era.
So one last time, here’s what we got.
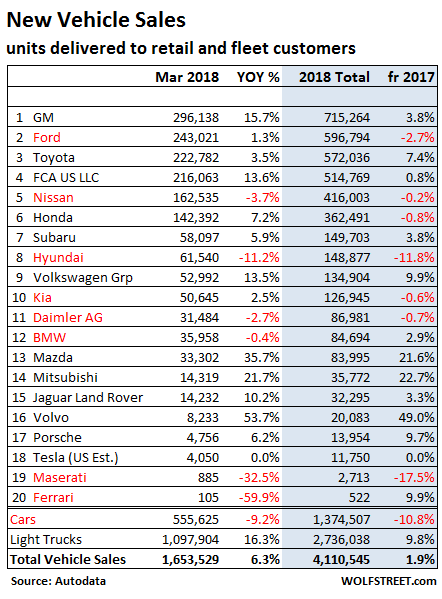
Total new-vehicle sales in the US rose 6.3% in March year-over-year to 1.654 million units. This lifted year-to-date sales by 1.9% to 4.11 million units.
These sales represent the number of vehicles delivered by dealers to their customers, or delivered by automakers directly to large fleet customers, as reported by Autodata. So unit sales, not dollar sales.
“Truck” sales soared 16.3% in March year-over-year. Car sales plunged 9.2%. Year-to-date, truck sales were up 9.8%, car sales down 10.8%.
But the industry-standard division between cars and “trucks” is somewhat misleading. “Trucks” include SUVs, compact SUVs (crossovers), pickups, and vans. SUVs and crossovers are immensely popular.
Crossovers are based on a unibody car chassis (instead of body-on-frame as is the case with trucks) and are just slightly higher and cooler versions of station wagons. For consumers, the switch from cars to crossovers is natural. So plunging car sales should be seen in light of surging crossover sales.
Including crossovers, “trucks” accounted for 66.4% of total sales, the highest ever for a March, and above 60% for the 21st month in a row.
The table below shows new-vehicle sales by automaker, sorted by total sales year-to-date (gray column). Automakers with declining sales either in March or year-to-date, or both, are marked in red. Note Hyundai’s ongoing sales plunge:
A special word about Tesla.
Tesla is hard to find on this list. It’s in 18th position near the bottom. But it doesn’t disclose how many vehicles it delivers in a month, and the industry has to estimate Tesla’s monthly US sales. For March and year-to-date, Autodata assumed that Tesla delivered the same number of units as last year. Even if this is off by a few hundred units, it makes no difference because Tesla has an inconsequential rounding-error-like market share of 0.3% year-to-date, compared to GM’s 17.4%.
Why the 6.3% gain in overall sales?
There are several reason for this increase, and two of them have nothing to do with the industry or what is sells:
- The selling-month of March had an extra selling day and went through April 2, which is always helpful.
- The selling-month of March contained the Easter Weekend, including Monday, April 2! Easter is a big sales weekend. Last year, Easter fell into the middle of April.
- Huge incentives. J.D. Power estimated that the average incentive spending was $3,849, up $74 from March last year, amounting to 10.3% of MSRP.
But the prices…
Despite incentives averaging 10.3% of MSRP, the estimated average transaction price, which includes incentives and dealer discounts, rose by $703 year-over-year to $35,285 in March, according to Kelly Blue Book. It shows how crazy automakers are going on inflating their sticker prices.
Inventories of new vehicles on dealer lots, in terms of days’ supply, were flat with last year, at 70 days, according to estimates by J.D. Powers a few days ago. 60 days is considered the upper limit of healthy.
Now the headwinds.
The selling month of April started on April 3 and lacks Easter, unlike last year. Easter and that Monday will be sorely missed. So in April, some of the sales gains in March are going to unwind. I’m certain that analysts and the media would point out that April was short and lacked the Easter weekend, though they assiduously forgot to mention that March benefited from the early Easter (though they did mention the extra selling day). But this is theoretical since GM won’t report April sales, and we’ll grope around in the dark.
Rising interest rates will push new vehicles out of reach for more and more people, and they will continue to step down the ladder to used vehicles.
Soaring defaults on subprime auto loans are causing lenders to tighten up their underwriting standards, and many potential buyers with subprime credit ratings cannot finance the new vehicle that they chose. Dealers will then switch them to a used vehicle. This trend, which we have observed since 2016, and was largely responsible for industry sales in 2017 falling below the levels of 2015!
But it’s now getting more serious. Over the first two months this year, according to J.D. Powers, new-vehicle deliveries to customers with subprime credit ratings dropped 9%. And this trend, with overall credit conditions tightening, is not going to reverse anytime soon.
When will investors get tired of feeding their capital into this cash-burn machine? Read… Tesla Gets Slammed by Tesla