via @KimbleCharting
Just over 3 weeks ago, I shared a chart looking at the divergence that has been brewing under the surface of the S&P 500 (NYSEARCA:SPY).
Since that post, the S&P 500 finds itself in a deep pullback, with other key stock market indices hitting correction territory at their lows.
Today we provide another look at the divergence and highlight why it’s time for investors to pay closer attention.
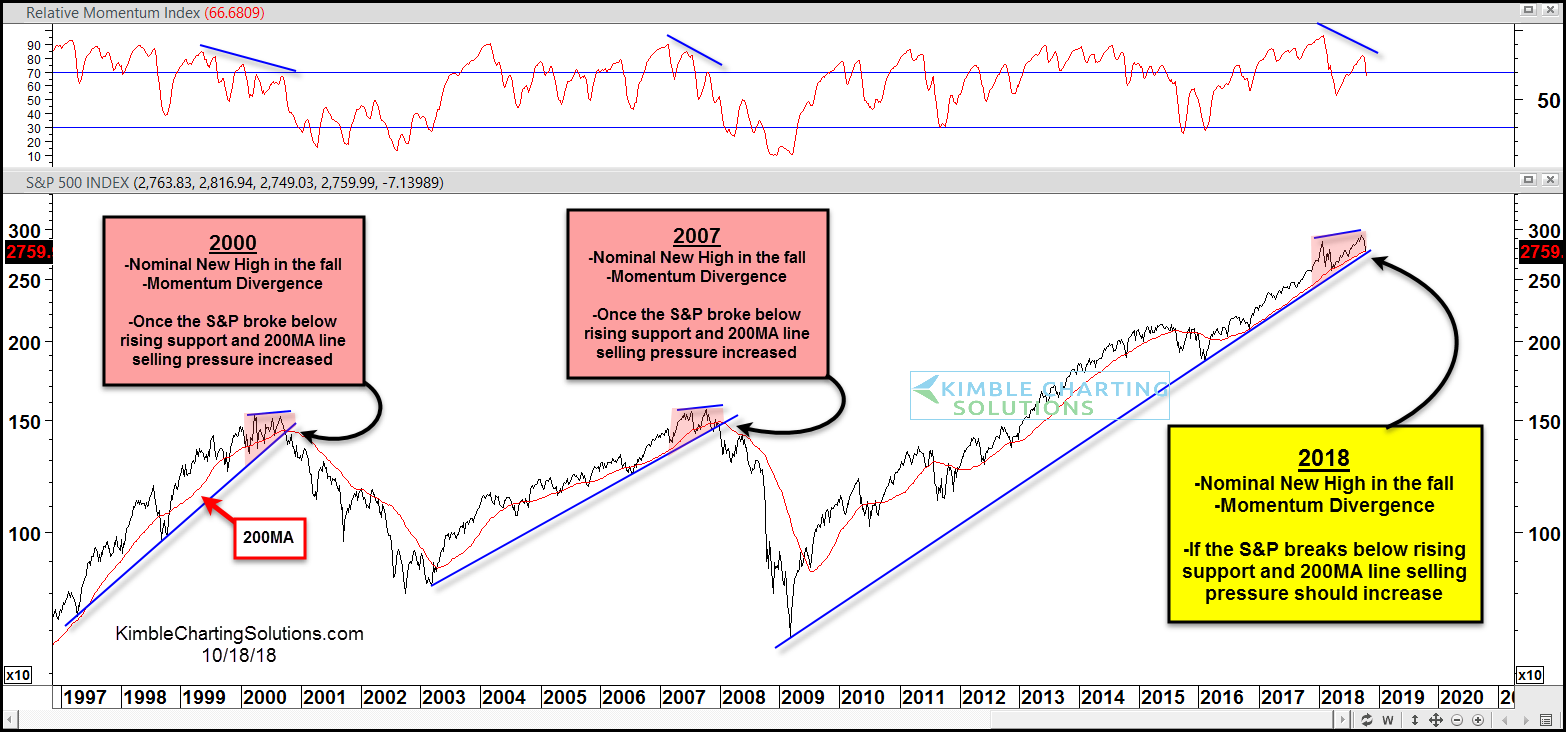
In the chart below, we compare today’s setup to 2000 and 2007 and the market crashes that followed. Note, though, that we have NOT broken trend support yet.
Similar to today, in 2000 and 2007 the S&P 500 made a nominal new high while putting in a lower high in momentum (a market divergence). And once the S&P broke key support marked by its up-trend line and 200 day moving average, the selling pressure increased.
Will this historic divergence pattern lead to selling yet again? Watch that up-trend support!
S&P 500 Chart – Teetering On The Precipice?
Note that KimbleCharting is offering a 2 week Free trial to See It Market readers. Just send me an email to services@kimblechartingsolutions.com for details to get set up.
Twitter: @KimbleCharting