Stocks are at “THE line”… but can they break it?
The S&P 500 have been chopping just below overhead resistance (red line in the chart below) for two weeks now.
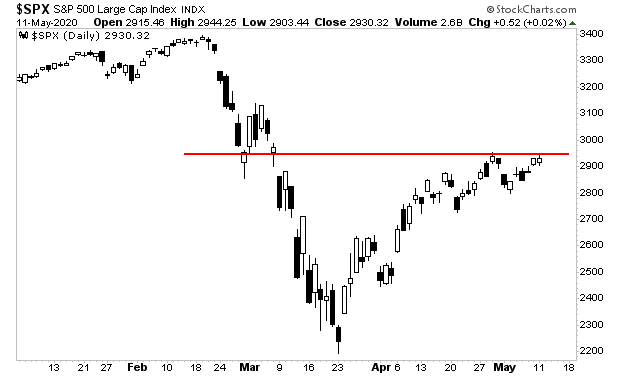
The significance of this level cannot be overstated. This line ALSO represents the 61.8% Fibonacci retracement of the market decline in March.
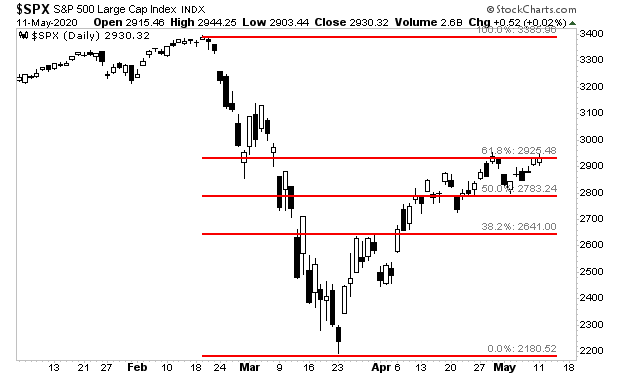
It is widely believed that a break above the 61.8% retracement line indicates stocks are in a NEW bull market, not a bear market bounce. Again, the significance of this level cannot be overstated.
One chart that has caught my attention is the monthly chart for long-term treasury ETF (TLT). This chart appears to be indicating a major “risk on” move is coming in the financial system. IF TLT breaks below that red line it could ignite a major bull run in stocks to new highs.
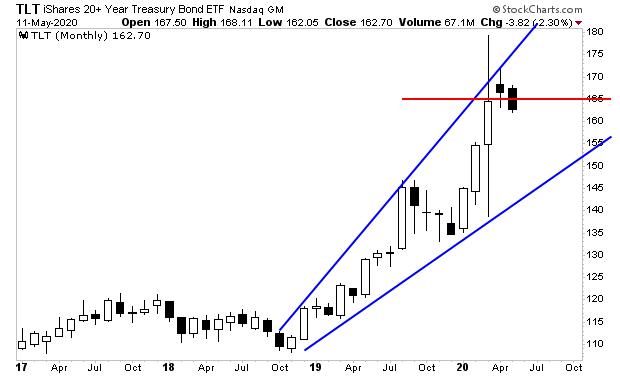
Interestingly, a big breakdown in bonds would indicate a sharp rise in inflation.
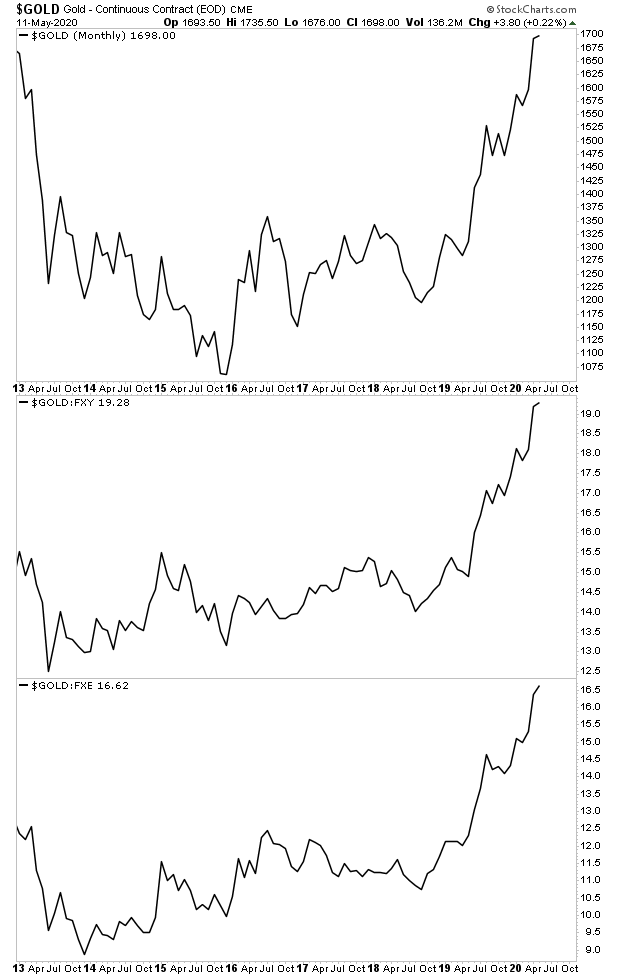
Gold is saying something similar: we’ve had breakouts in every major currency. This too says big inflation is coming.