by Dana Lyons

Stocks’ record streak without a weak close came to an end yesterday; what does it mean going forward?
By any name – melt-up, relentless bid, creep, etc. – the recent advance in the stock market has been impressive. And there is no shortage of statistical means by which to demonstrate that – in some cases, unprecedented – impressiveness. Last week, we look at the NASDAQ 100’s record streak of closes above the bottom of 40% of its daily range. Today, we look at a similar record-tying streak in the S&P 500 that came to a close yesterday.
Specifically, before yesterday, the S&P 500 had gone 35 straight days without a close in the bottom 20% of its daily range. In other words, it hadn’t had a “weak” close in nearly 2 months. For context, that is a record-tying streak going back to at least 1984 (our high-low data prior is a bit spotty). So what does it tell us?
Besides merely emphasizing the fact that stocks have maintained an extraordinarily persistent bid over that time, it caused us to look at other similar streaks in the past for possible instruction as to future performance – i.e., was there follow-through to the streak-ending selling pressure, or did the persistent bid quickly resume again? As such, we looked at every streak in the past 30-plus years that saw the S&P 500 close above the bottom 20% of its daily range for at least 30 days in a row. As it turns out, there were 7 prior such streaks.
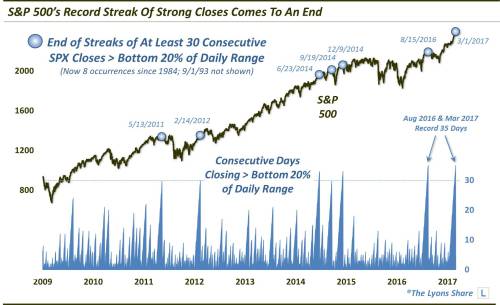
If it’s tough to see on the chart, these were the dates on which the streaks ended, and the # of days the streak lasted:
9/1/1993 (33)
5/13/2011 (30)
2/14/2012 (30)
6/23/2014 (33)
9/19/2014 30)
12/9/2014 (33)
8/15/2016 (35)
3/1/2017 (35)
As you can see, the last such streak this past August was the other record-tying 35-day streak. That date, August 15, happened to mark the highest close in the S&P 500 until the midst of the post-election rally more than three months later. Such weakness has been more the norm than the exception following these streaks. That can be seen in the following table of the S&P 500?s performance following the end of the previous 30-day streaks.
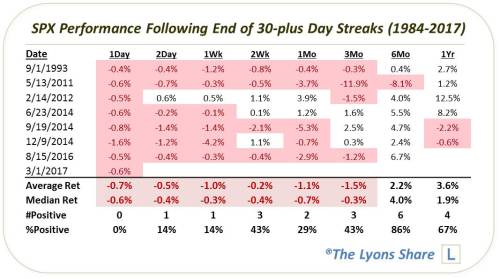
Of the prior seven streaks, most showed little to no upside in the months following the streaks. And more than half of them exhibited larger than normal drawdowns in the weeks and months following the streaks. That said, in most cases, the weakness was temporary and by six months later the index had recovered considerably.
We will see how the bulls respond to this first hint of adversity in a long time. Will they quickly put it behind them and move ahead like an all-star caliber baseball closer – or are they now rattled? Based on the study here, while it is admittedly a limited sample size, any potential edge we can perceive from the aftermath of similar strong-closing streaks would suggest that follow-through to yesterday’s selling pressure would be a fairly good bet.