Amazing data visual. Each dot = $100,000 in aid to Ukraine during 2022.
https://twitter.com/WallStreetSilv/status/1602413397710147615
https://twitter.com/WallStreetSilv/status/1602413397710147615

BBC: “Dutch shooting: Utrecht police arrest suspect after three killed – arrested because of his connections with [IS] but released later” A man has been arrested following a shooting on a tram in the Dutch city of Utrecht which left …
Interactive chart: https://www.walletwyse.com/analytics/global-etf-index This chart pulls same-day quotes for major ETFs indexed to specific foreign markets. For larger financial markets like China, Japan and Germany, the chart returns the average of the 2-3 largest dedicated ETFs. To calculate total return over …
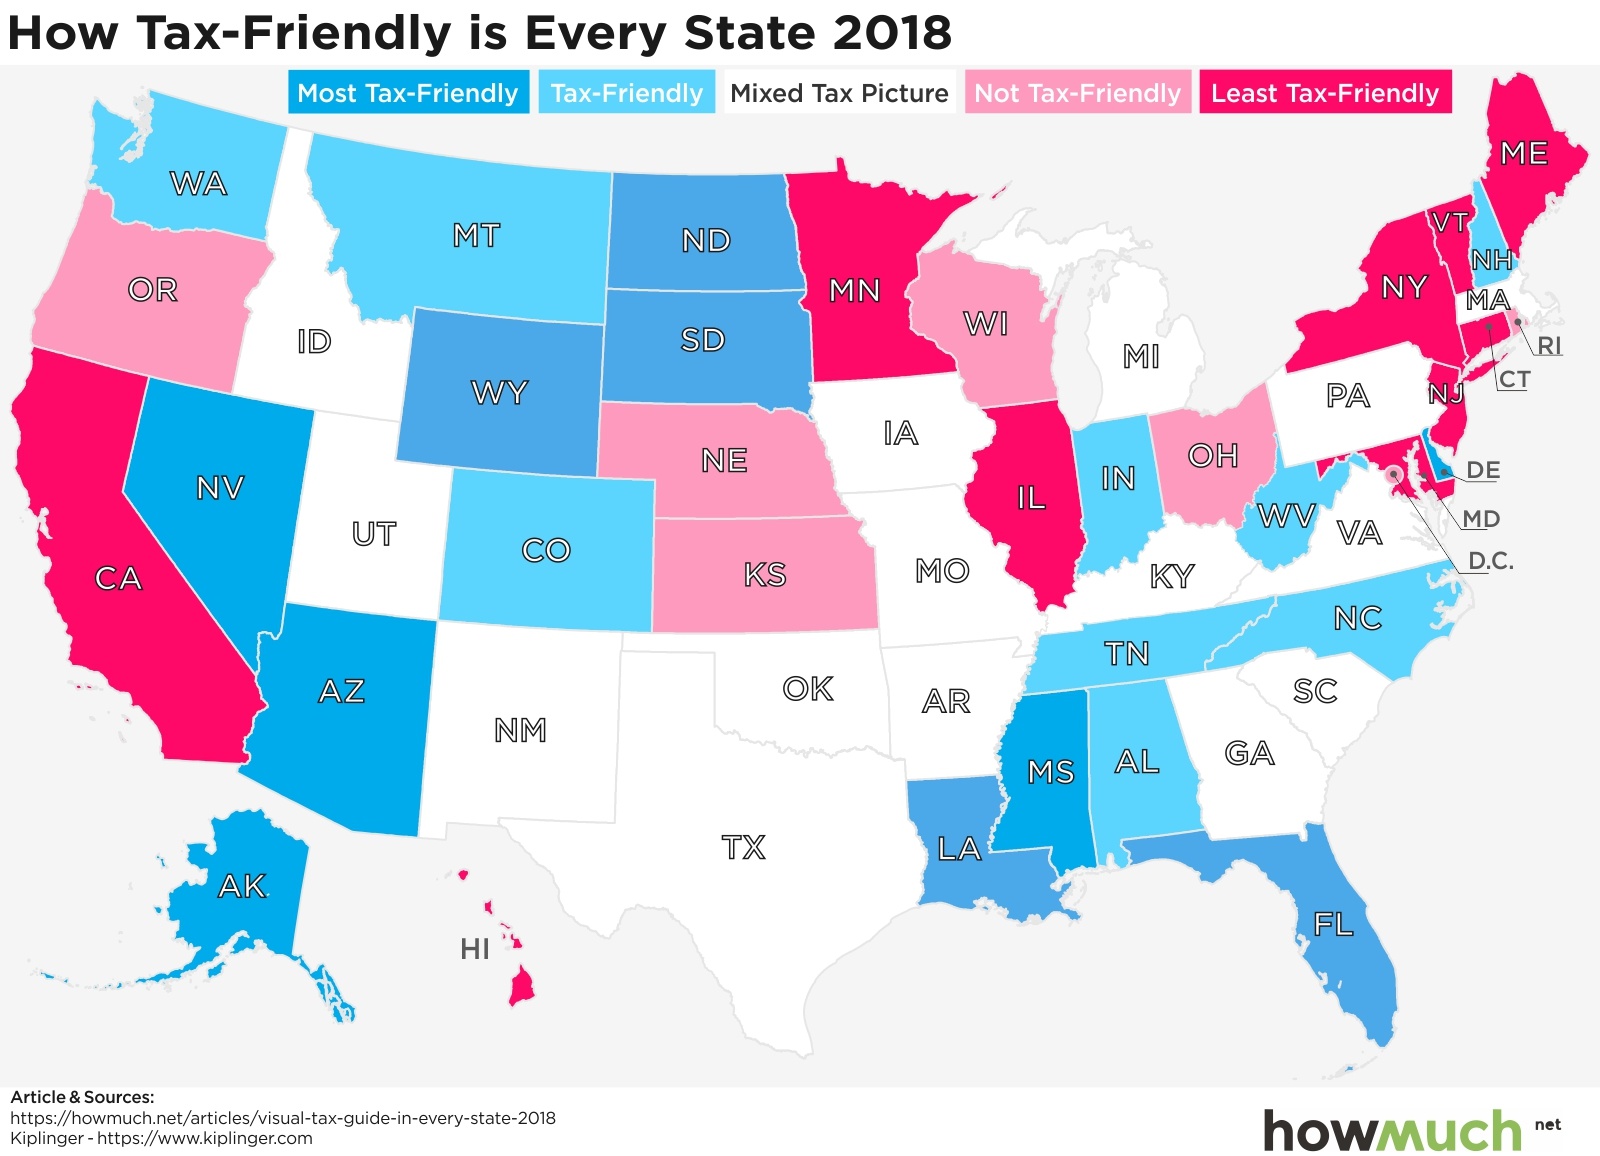
by howmuch The midterm elections are right around the corner, and President Trump just announced he wants to cut middle class taxes by 10 percent. It’s obvious people don’t like paying taxes, and letting workers keep more of their paychecks could …
via visualcapitalist: In the startup era, it’s easier than ever to launch a new business. With barriers to entry for new ventures at historic lows, it’s now extremely common to see aspiring entrepreneurs from all walks of life – including many …

by stockboardasset On April 14, 2018, starting around 4 am Syrian time, the United States, France, and the United Kingdom conducted a missile bombardment with bombers, fighter jets, and ship-based cruise missiles against government sites in Syria. The U.S.-led assault on Syria …