In this past weekend’s missive, “Did The Powell Put Change Anything?,” I discussed the surge in the market following Jerome Powell’s change of stance on Fed policy and the potential for a Trump to acquiesce to China in order to boost the stock market.
“While Goldman is leaning more towards an “escalation,” President Trump has staked his entire Presidential career to the stock market as a measure of his success and failure.
If President Trump was heading into the meeting this weekend with the market at record highs, I think a “hard-line” stance on China would indeed be the outcome. However, after a bruising couple of months, it is quite possible China will see an opportunity to take advantage of a beleaguered Trump to keep negotiations moving forward.
This is also particularly the case since the House was lost to the Democrats in the mid-term. This is an issue not lost on China’s leadership either. With the President in a much weaker position, and his second tax cut now “DOA,” there is little likelihood of any major policy victories over the next two years. Therefore, the risk to the Trump Administration is continuing to fight a ‘trade war’ he can’t win anyway at the risk of crippling the economy and losing the next election.”
Not surprisingly, that is exactly what happened.
With smiles and much back-patting to go around, the G-20 meeting ended with a “roar of applause but the accomplishment of nothing.”
Nonetheless, as I also pointed out, the market did reach extremely oversold levels during the October/November correction which provided the necessary “fuel” for a short-term rally. All the market needed was a “reason” and Trump’s weakened stance with China over trade provided just that.

The Bullish View
The good news is that on Monday the market cleared the 50- and 200-day moving averages. This was an important level of overhead resistance the market needed to clear to get back onto more bullish footing. However, in order for that break to be validated, it must hold through the end of the trading week.
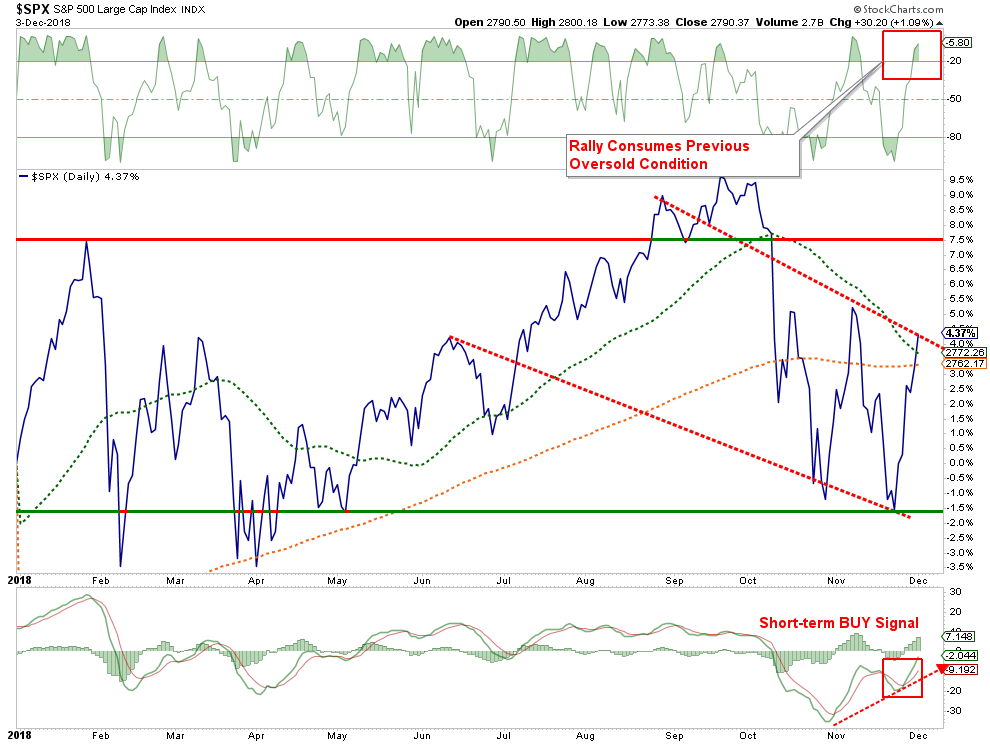
Also, on a very short-term basis, the market has triggered a short-term “buy signal.” From a trading perspective, this does provide support for a rally in the short-term. As Richard Mojena noted in his commentary this past weekend:
“The nearly 5% gain this past week was an impressive surge off the primary downtrend’s lows from just the previous week, with some key resistance trend lines taken out. The model’s technical indicators leapt in response, notably tripping two key indicators (index vs month-end trend and statistically significant weekly percent increase) from sells to buys. Monetary and sentiment indicators improved some as well.
This buy signal came just after the confirmation of a new primary downtrend at 9 weeks with a decline of -10%. Just one week ago the S&P 500 at -10.2% from its September high visited correction territory and at +0.1% was barely above water year-to-date, breathing only from its dividends. The index itself (without dividends) was off -1.5% YTD. And now the SPX is up 5% year-to-date. What a difference a week makes. The model now believes with 80% probability that a new primary uptrend is underway, although its realization may very well be rocky.”
If he is correct, then our longer-term indicators should turn positive the weeks ahead as well. As noted at RIA PRO we did add some equity exposure to portfolios on Friday, but are still holding a higher level of cash than normal. As shown below, the 61.8% Fibonacci retracement level, and the 2016 bullish trend line, have remained formidable adversaries to the previous rally attempts. However, if the lower “sell signal” is reversed, such would likely coincide with a breakout above resistance and confirm a new uptrend is underway.
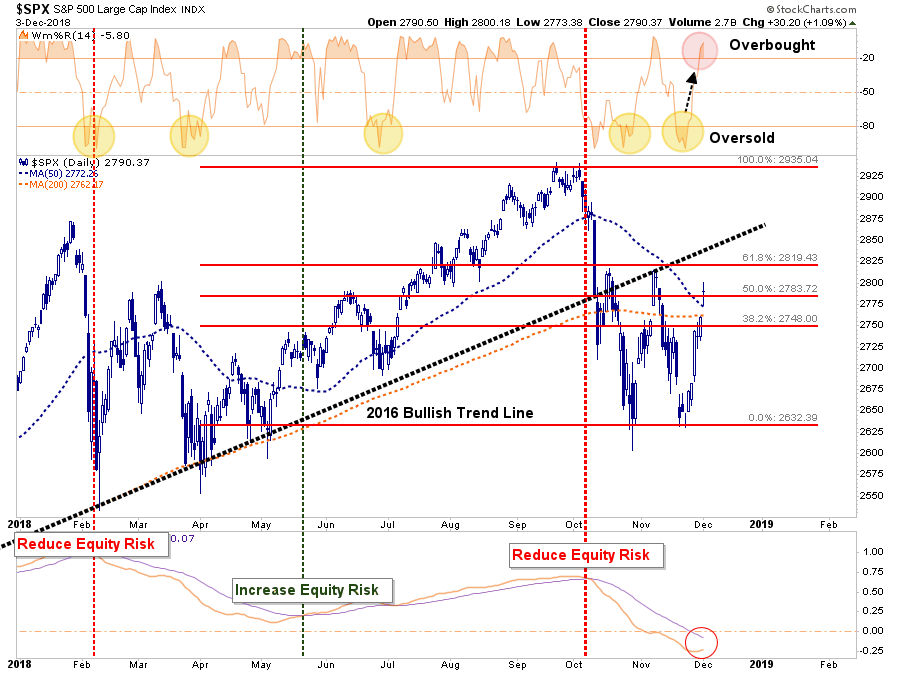
“IMPORTANT: It is the success or failure of this rally attempt will dictate what happens next.
- If the market remains above the 50-dma AND breaks above resistance at 2820, then another attempt at all time highs is likely. (Probability Guess =40%)
- However, if this rally fails such will result in a continuation of the correction back to recent lows. (Probability Guess = 60%)”
The Bearish View
So, why did I give Option #2 a greater weighting?
This is because, despite the recent oversold surge from lows, the primary backdrop of the markets has not changed markedly.
- The “trade truce” was nothing more than that. China is not going to back off its position on “Technology Transfers” as that is the key to their long-term economic future. This means that either Trump caves into China or we will be back to a full on “trade war” in 2019.
- The Federal Reserve is still reducing their balance sheet by $50 billion per month which has removed a primary buyer of U.S. Treasuries at a time when the Government has gone on an unfettered spending spree.
- With the Democrats in control of the House, there will likely be “no” constructive legislative action to note in the next year. However, there is almost an absolute guarantee of more anti-Trump actions being lofted from the “Pelosi House.”
- Valuation remains extremely elevated despite the recent correction.
- Most importantly, year-over-year earnings growth rates are set to deteriorate markedly in 2019 as both the effect of the 2018-tax cuts vanishes and end-of-year estimates still remain way too high.
- The deterioration in credit is accelerating
- Economic growth has likely peaked.
As noted by Carl Swenlin of Decision Point this past weekend:
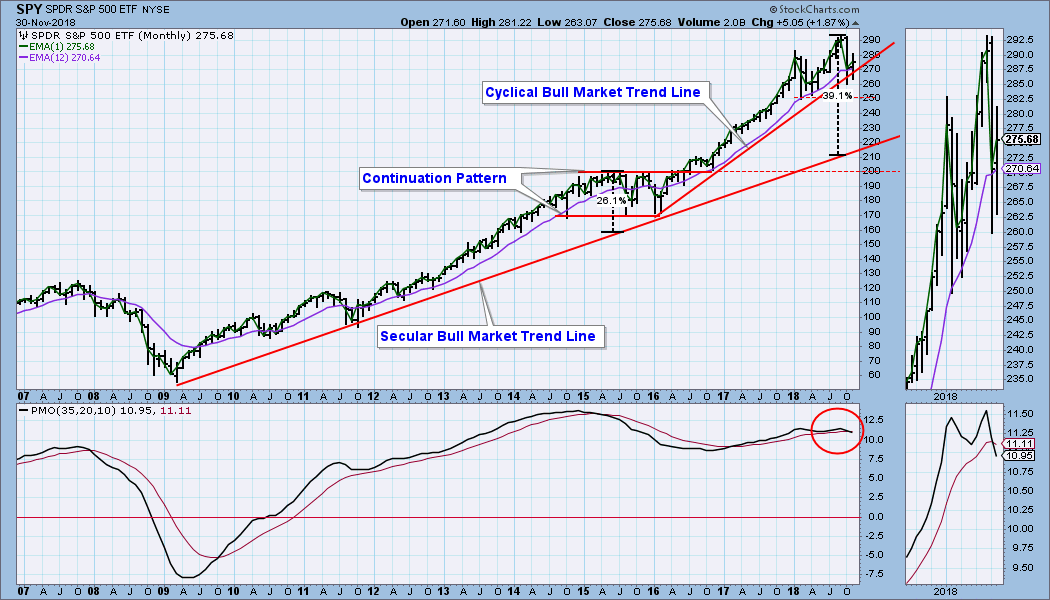
“SPY’s departure from the secular bull market rising trend line reached about +39% this year, as opposed to a departure of only +26% in 2015. That kind of excess begs for a correction. The monthly PMO has topped and crossed down through the signal line. This typically forecasts a lengthy period of decline.”
As he concludes:
“The S&P 500 hasn’t had a ‘Death Cross’ yet (50EMA passes down through the 200EMA), but 51% of S&P 500 components have. I continue to believe that we are in a bear market; however, recent price action has certainly been encouraging for the bulls. The promise of the positive divergences on the chart just above has been partially fulfilled, but the short-term indicators are becoming overbought, and time could be running out on the rally. It will take an advance of just +6.5% for the market to make new, all-time highs, but, if I am right about the bear, it’s not going to happen.”
Balancing Act
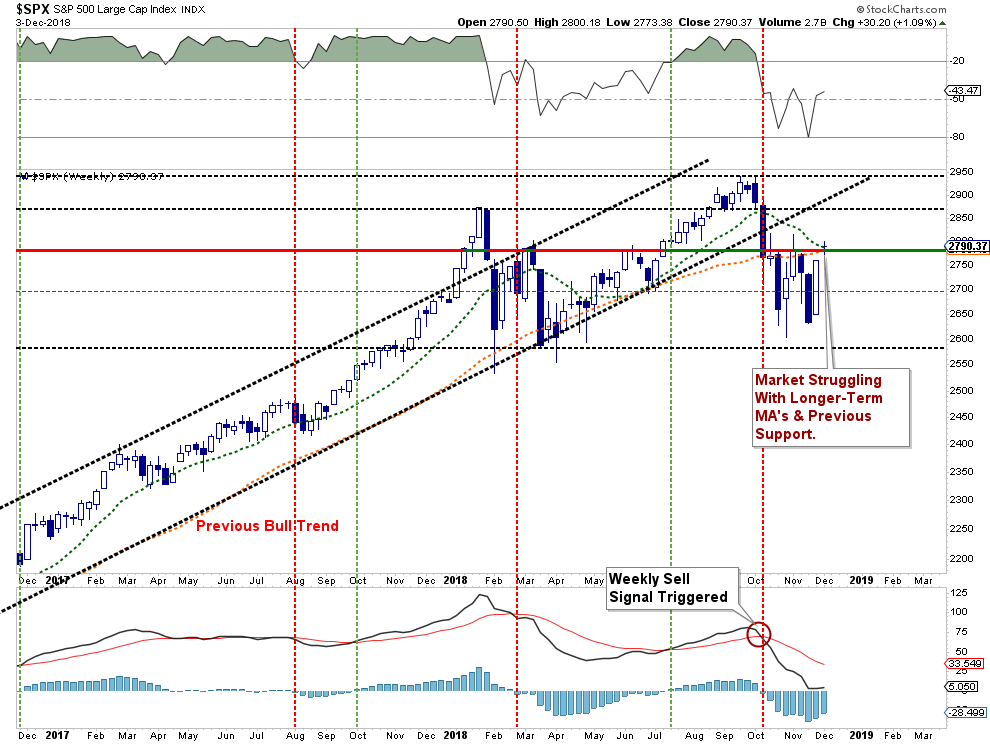
Weighing both the short-term bullish view and the longer-term bearish outlook is difficult. Despite the rally on Monday, the market still remains mired on a primary “sell signal,” has violated it’s long-term bullish trend and faces a substantial amount of headwinds heading into 2019.
The risk current remains to the downside, and we must wait until the end of the week to see if the “bulls” can take back the reins of the market.
There is little doubt the “bullish bias” persists currently, and the volatility this past year has made managing money more difficult than usual.
But that is the nature of markets and how “topping processes” work.
Given we are in the “seasonally strong” period of the year, it would not surprise me to see the markets try and muster a rally into January. But there are certainly some challenges to face over the next week or so as mutual funds are now firmly into their annual distribution period and Jerome Powell may reassert his “hawkishness” again next week which could spoil the party.
A look at the weekly internals of the market shows some notable deterioration in the advancing-declining issues. With a weekly “monthly” sell-signal in place, caution remains a primary consideration. Importantly, given these are monthly signals, it does NOT MEAN stocks can’t rally in the short-term. It simply suggests there is selling pressure on stocks and the path of least resistance currently is lower.
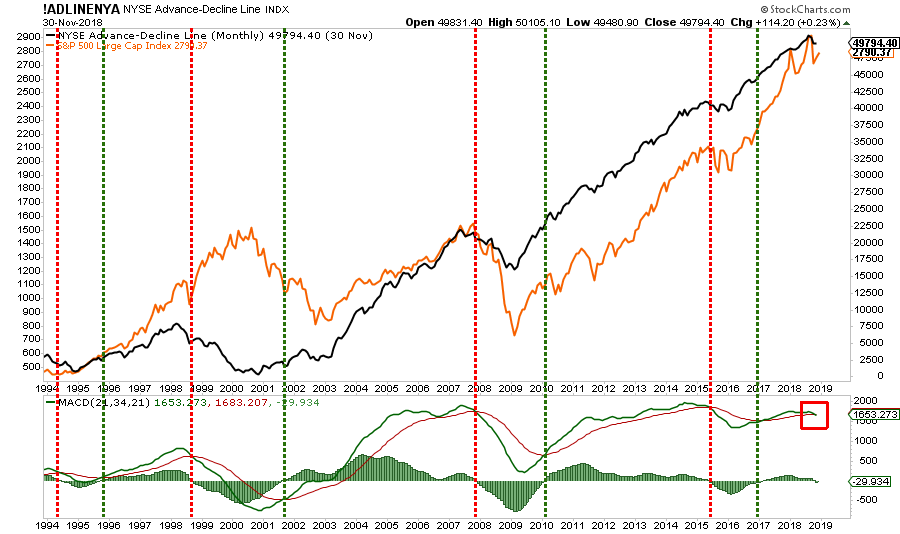
Again, while a short-term bounce in likely given the recent sell-off, it will require a move to new highs to reverse the currently more “bearish” dynamics at work in the market.
While anything is certainly “possible”, we have to manage money on “probabilities.”
And right now, the probabilities remain to the negative.
Conclusion & Suggestions
Given the weekly “sell” signals currently in place, the recommendation to rebalance portfolio risks remains. Here are the guidelines I recommended previously:
Step 1) Clean Up Your Portfolio
- Tighten up stop-loss levels to current support levels for each position.
- Take profits in positions that have been big winners
- Sell laggards and losers
- Raise cash and rebalance portfolios to target weightings.
Step 2) Compare Your Portfolio Allocation To Your Model Allocation.
- Determine areas requiring new or increased exposure.
- Determine how many shares need to be purchased to fill allocation requirements.
- Determine cash requirements to make purchases.
- Re-examine portfolio to rebalance and raise sufficient cash for requirements.
- Determine entry price levels for each new position.
- Determine “stop loss” levels for each position.
- Determine “sell/profit taking” levels for each position.
Step 3) Have positions ready to execute accordingly given the proper market set up.
As noted previously in 10-Investment Wisdoms:
“The absolute best buying opportunities come when asset holders are forced to sell.” – Howard Marks
We haven’t gotten to that point just yet.