In this past weekend’s newsletter we stated:
“This short-term oversold condition, and holding of minor support, does set the market up for a bounce next week which could get the market back above the 200-dma. The challenge, at least in the short-term remains the resistance level building at 2800.”
That bounce occurred on Monday which allowed us to add some trading positions to our portfolios. We update all of portfolios regularly at RIA PRO (Try now for FREE for 30-days with Code: PRO30)
Our job as portfolio managers is simple:
- Protect investment capital, and; (Long-term view)
- Take advantage of opportunity when it presents itself. (Short-term view)
The blending of the short and long-term views is the difficult part for readers to understand.
“If you have a long-term bearish view on future market returns, how can you be increasing equity exposure?”
Because, as rule #2 states, our job is to make money when we can while avoiding the long-term risk of capital destruction. As such, we must marry the long-term views with short-term opportunities which don’t necessarily always align.
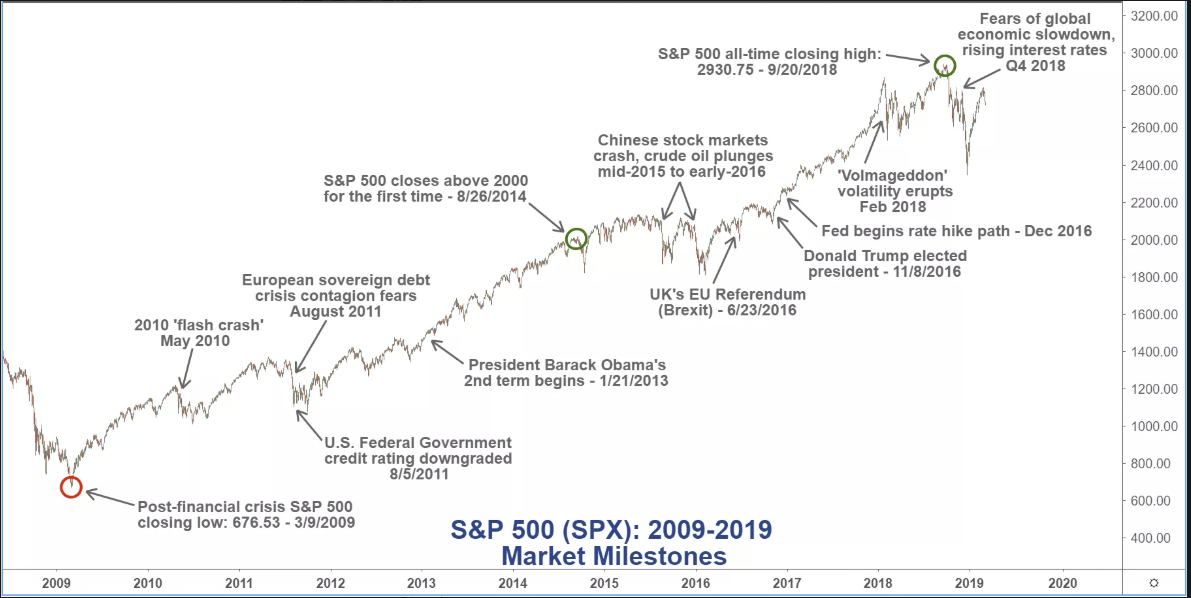
For example, the media was full of commentary over the weekend discussing the market’s 10th anniversary.
“The U.S. bull market turned 10-years old Saturday, underscoring the resilience of a rally that has persisted despite tepid global growth, anxieties about central bank policies, and mounting trade tensions.” – WSJ
Yes, March 9th marked the 10-year mark of a bull market that started on that same day in 2009. Although there have been a few bumps along the way, the long-term bullish trend has remained intact.
“So, why can’t it just continue for another 10-years?”
It’s a important question and investors should review the catalysts of the last decade.
In 2009, valuations had reverted to the long-term average, asset prices got extremely oversold, and investor sentiment was extremely negative. These are all the ingredients necessary for a cyclical bull market which David Rosenberg detailed on Monday:
“Yes, this was indeed the third strong run-up in the S&P 500 on record with a total return increase of 400%. But in inflation-adjusted dollars, the $30 trillion expansion was a record, taking out the $25 trillion surge in real terms from December 1987 to March 2000.
As David details, the supports for the ensuing rally were abnormal in many aspects.
- The government bailed out insolvent banks.
- There were two massive fiscal stimulus programs separated by 8-years.
- The Fed funds rate was ZERO for eight years, and repeated intervention into the marketplace boosted the Fed’s assets six-fold. How could asset values not be influenced by the central bank taking $4.5 trillion of ‘safe’ securities out of the public market?
- Because there were no investable opportunities, cloud computing and AI aside, there was no capital deepening cycle. Cash flows (from tax relief too) were diverted to stock buybacks and dividend payments. The share count of the S&P 500 hit two-decade lows alongside two crazes – buybacks and M&A.
- The Fed’s policies ignited the mother of all leverage cycles in the corporate sector. And it’s not all just about BBB-rated bonds. It’s about private equity, which experienced a massive credit bubble this cycle as well.
- The WSJ mentions ‘anxieties’ about central banks even though they have been the best friend to the investing class than they have ever been in modern history.
- The article also posited that the 10-year bull run confronted “mounting trade tensions.” Well, in truth, by the time these tensions began, in early 2018, over 90% of the bull markets was behind us.
- What sort of market has but 4-companies accounting for 9% of the total return of this 10-year cycle; and 20 of the S&P 500 representing 30% of the total return gain? Answer- a highly concentrated one.
Importantly, this is what happened.
The challenge for investors will be what happens next.
Currently, there is an overwhelming “hope” that what happened over the last 10-years will continue over the next ten. This is a psychological tendency known as “recency bias,” and is one of the biggest behavioral mistakes investors make when it comes to investing.
However, history suggests that the opposite is true more often than not. As I wrote previously:
“’Record levels’ of anything are ‘records for a reason.’
It should be remembered that when records are broken, that was the point where previous limits were reached. Also, just as in horse racing, sprinting or car races, the difference between an old record and a new one are often measured in fractions of a second.
Therefore, when a ‘record level’ is reached it is NOT THE BEGINNING, but rather an indication of the PEAK of a cycle. Records, while they are often broken, are often only breached by a small amount, rather than a great stretch. While the media has focused on record low unemployment, record stock market levels, and record confidence as signs of an ongoing economic recovery, history suggests caution. For investors, everything is always at its best at the end of a cycle rather than the beginning.”
It isn’t just the stock market hitting record levels in terms of time, but also the economy. According to WSJ’s Alan Blinder:
“Only two economic expansions since 1854 have lasted longer than 100 months, and none have lasted more than 120 months. If the current expansion lasts into July, it will be the longest in history.”
While the old Wall Street axiom is that “bull markets don’t die of old age,” old age usually brings most things closer to the end. As I showed previously in “Is The Market Predicting A Recession?” stocks usually peak, and trough, ahead of the economy.
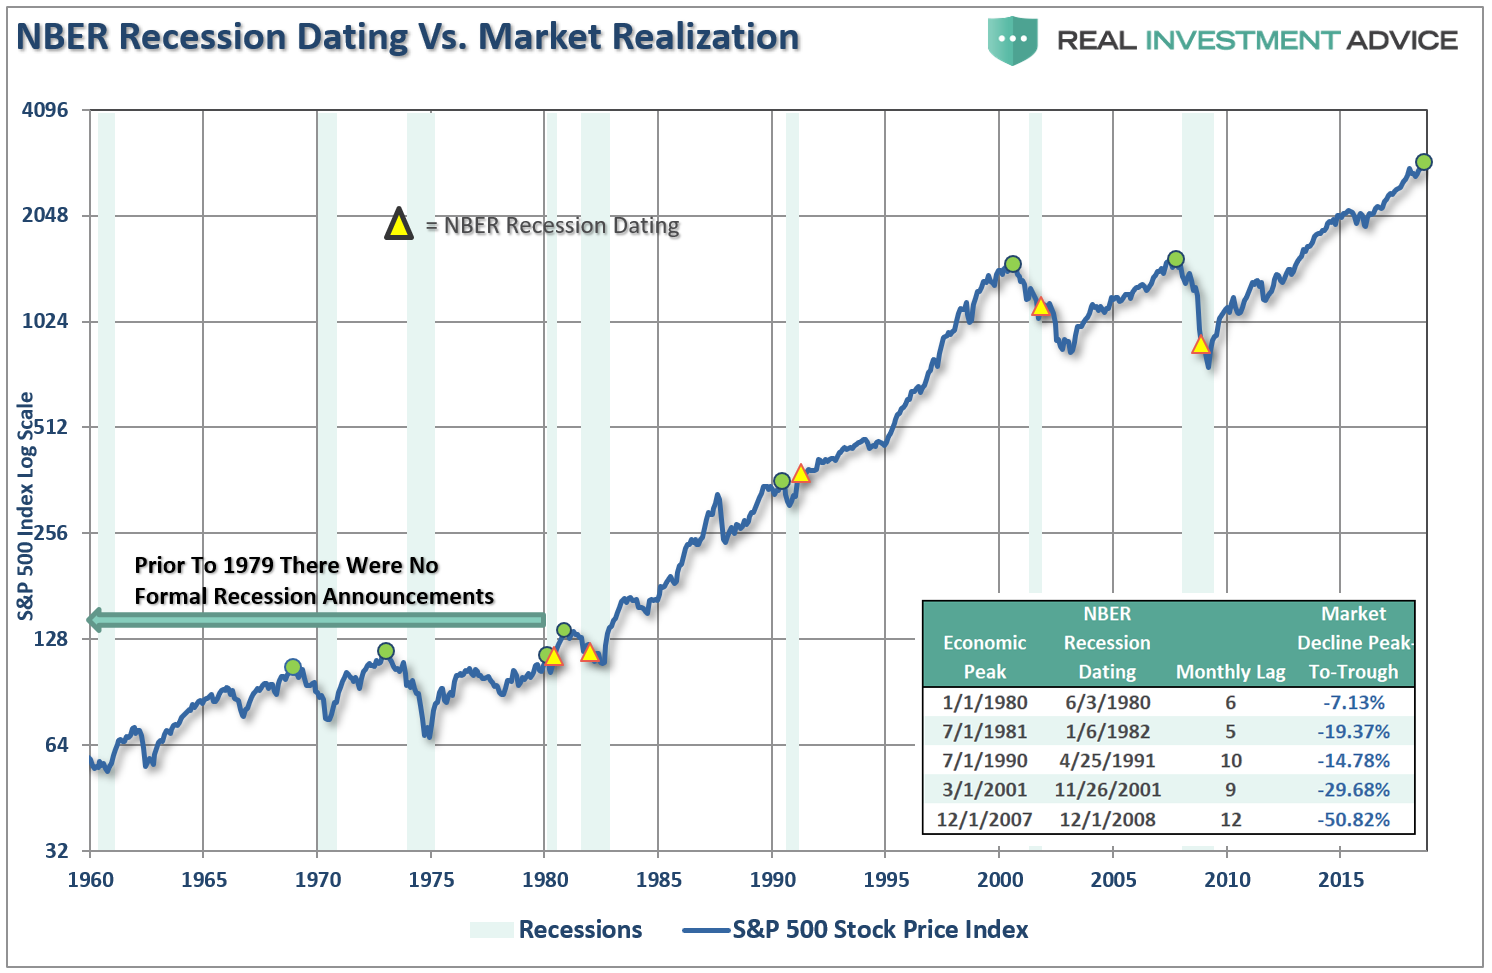
As John Murphy noted last week for StockCharts:
- The bull market that ended in March 2000 preceded an economic downturn by a year.
- The October 2007 stock market peak preceded the December economic peak by two months.
- The March 2009 stock upturn led the June economic upturn by three months.
- Historically, stocks usually peak from six to nine months ahead of the economy. Which is why we look for possible stock market peaks to alert us to potential peaks in the economy that usually follow. And we may be looking at one.
The weekly chart below shows the S&P 500 hitting an all-time high last September before falling nearly 20% into the end of 2018. While the first two months of 2019 has seen an impressive surge back to its November highs, the market is starting to build a pattern of lower highs, and lower bottoms. More importantly, both relative strength and the MACD indicators are trending lower and negatively diverging from the markets price action.
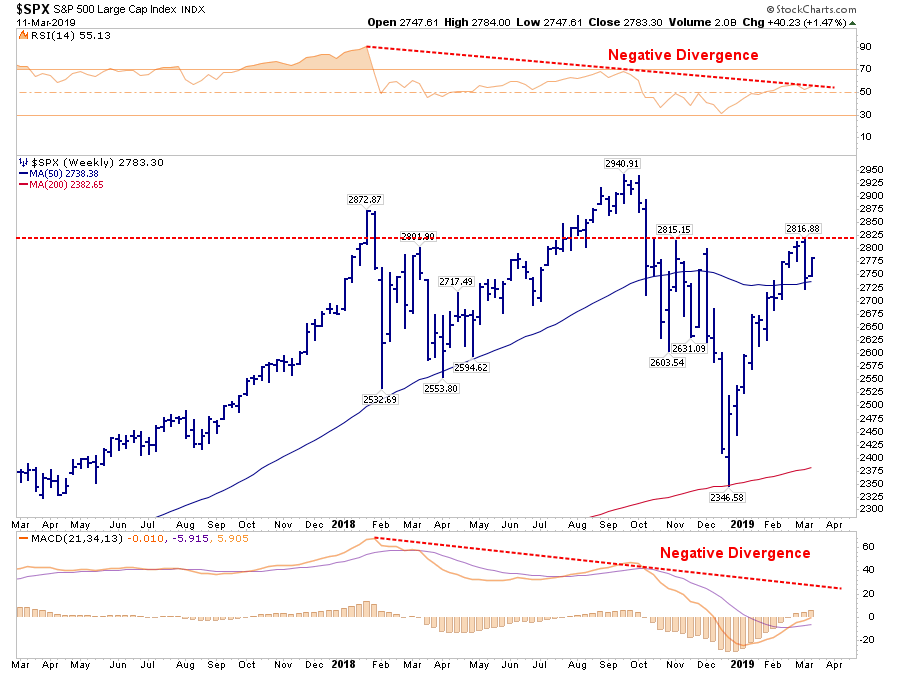
Each week on RIA PRO we provide an update on all of the major markets for trading purposes. (See an unlocked version here. We also do the same analysis for each S&P 500 sector, selected portfolio holdings, and long-short ideas. You can try RIA PRO free for 30-days with code PRO30)
John continues by looking at the monthly chart of the S&P 500 going back 10-years to the start of the bull market.
“The uptrend is still intact. The sharp selloff that took place during the fourth quarter of 2018 stayed above the rising trendline drawn under its 2009, 2011, 2016 lows. That’s the good news. What may not be so good are signs that long-term momentum indicators are starting to weaken. The two lines in the upper box plot the monthly Percent Price Oscillator (PPO). [The PPO is a variation of MACD and measures percentage changes between two moving averages].
The PPO lines turned negative during the second half of last year when the faster red line fell below the slower blue line. And they remain negative. [The red histogram bars plotting the difference between the two PPO lines also remain in negative territory below their zero lines (red circle)]. Secondly, and maybe more importantly, the 2018 peak in PPO is lower than the earlier peak formed at the end of 2014. That’s the first time that’s happened since the bull market began. In technical terms, that creates a potential ‘negative divergence’ between the PPO lines and the S&P 500 which hit a new high last September.
This raises the possibility that the ten-year bull market may have peaked in the fourth quarter and is now going through a major topping process. If the bull market in stocks is nearing an end, that could start the clock ticking on the nearly ten-year expansion in the U.S. economy. That might not prevent it from setting a new record for longevity this July, but it might diminish its chances for celebrating the eleventh anniversary in the summer of 2020.”
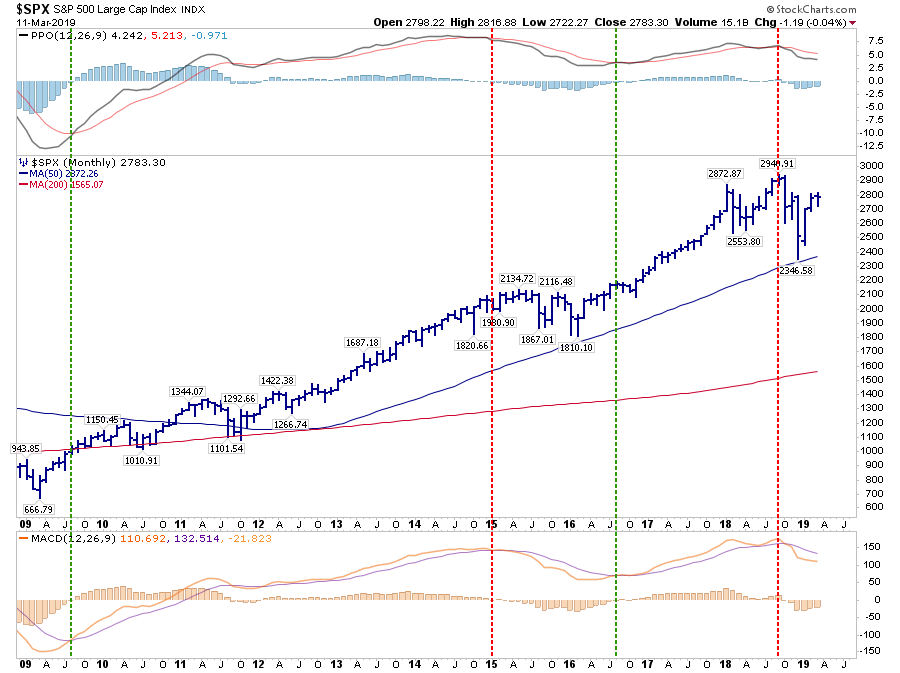
These same negative divergences can be seen in the monthly chart below going back to 1995. Whenever the long-term bull trend lines have been broken from a topping process, with negative divergences, and monthly sell signals, it has been coincident with more major market topping processes.

Sure, this time could be different for a whole variety of reasons, but those generally fall into the category of “hope”rather than a systematic and disciplined approach to investing.
Even after the recent correction, long-term extensions and deviations remain at historically high levels which, historically speaking, have not been extremely kind to investors. But valuations, despite the recent correction, as still pushing 30x earnings as well.
As Brett Arends recently noted:
“From the viewpoint of long-term investment, major risks remain according to some long-term strategists. Yes, conventional wisdom on Wall Street tells you that stocks are likely to gain an average of around 9% a year. And yes, that’s based on the historical average going back at least to the 1920s. But, say some financial historians, that’s a misreading of the past. Stocks, they say, typically produced ‘average’ returns if you bought them at roughly ‘average’ valuations in relation to things like net assets and net income. And U.S. stock valuations today, they warn, are anything but average. According to price-to-earnings or ‘PE’ data tracked by Yale University finance professor and Nobel Prize winner Robert Shiller, the S&P 500 is about 75% above its historic average valuation. ‘
But it isn’t just the technical backdrop of the market that is completely reversed but also the fundamental and economic one. As I showed in “QE – Then, Now & Why It May Not Work:”
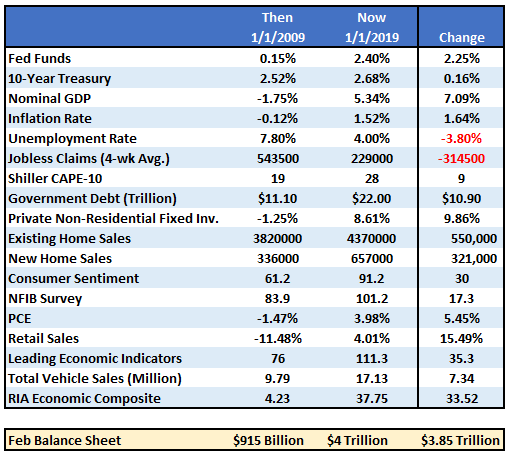
With the fundamental and technical backdrop no longer as supportive, valuations still near the most expensive 10% of starting valuations, and interest rates higher, the returns over the next decade will likely be disappointing.
However, that’s the long-term view and valuations are a “horrible” timing device. This is why we use a specific set of price indications over varied time frames to determine short-term risk versus reward.
Currently, the markets are rallying, so we need to participate.
As investors, we have to make money when “the cards are hot.” But just as important is knowing when it is time to “fold and step away from the table.”
I know it seems completely implausible today, but over the next decade there will be many who will have wished they had sold today.