
- The 2018 Bear Market Is Over…For Now
- Chart Watch – Jesse Colombo
- Sector & Market Analysis
- 401k Plan Manager
Follow Us On: Twitter, Facebook, Linked-In, Sound Cloud, Seeking Alpha

It’s Spring Break
It’s that time of the year again as my family and I make our annual pilgrimage to Utah for a few days of snowboarding and skiing. This year should be especially interesting as my wife and daughters have decided to join us “boys” in snowboarding. (Hilarity will surely ensue)
There are generally two events that happen every year – somebody forgets their coat, goggles or some other article of clothing needed for skiing, and someone visits the emergency clinic with a minor injury. Last year, it was my son who left his coat at the airport and then broke his collarbone showing off for some “cute” girls. (Yes, they are at that age – all hormones, no brain)
Nonetheless, it is always an adventure, but most importantly, given how busy our lives have become, it is a great time for all of us to reconnect as a family and build some terrific memories.
So, since we are packing to leave first thing in the morning, this week’s newsletter is going to be brief market review and positioning update. I will do a full review on my return.
Have a great Spring Break.
2018 Bear Market Is Over…For Now
by Lance Roberts
As I noted last Tuesday:
“Turning points in the market, if this is one, are extremely difficult to navigate. They are also the juncture where the most investing mistakes are made.
Over the last several weeks, I have been providing constant prodding to clean up portfolios and reduce risks. I also provided guidelines for that process – click here.
For now, it is important to note the ‘bullish trend’ remains solidly intact and, therefore, we must give the ‘benefit of the doubt’ to the bulls.”
I can not emphasize that last point enough.
- Yes, we had rebalanced portfolio risks and raised cash levels.
- Yes, we had added a short-hedge to our portfolios to protect against volatility risk.
- No, it does not mean we are “bearish” or “sitting all in cash.”
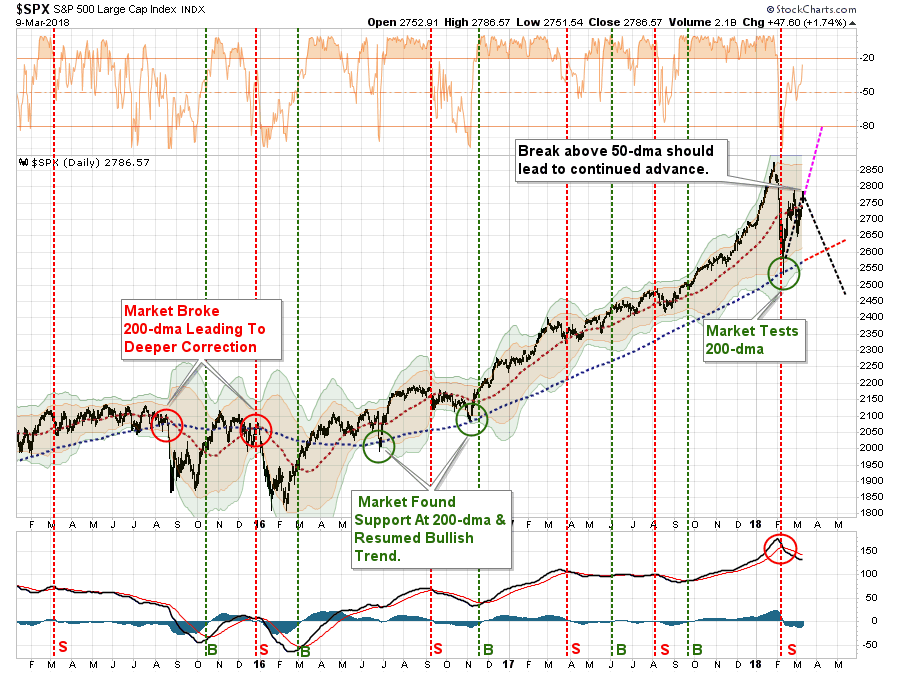
Portfolio management is never an “all in or out” process. It is about managing the potential risk for capital loss over time. In that regard, we have been tracking the consolidation process following the February correction.
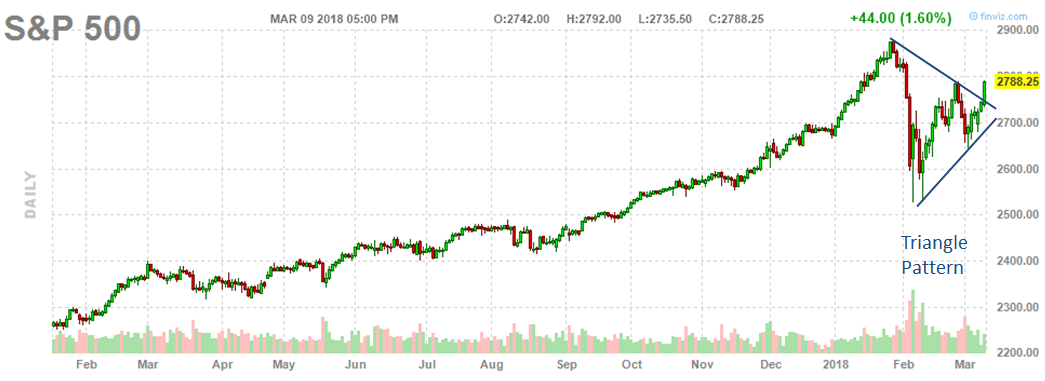
“The market is currently in the process of building a consolidation pattern as shown by the ‘red’ triangle below. Whichever direction the market breaks out from this consolidation will dictate the direction of the next intermediate-term move.”
Well, on Friday, the market made its move.

This is the third attempt to move above the 50-dma and the second attempt since registering a short-term “buy” signal in late February. This bullish backdrop kept portfolios primarily invested in equities, although we did hedge some risk last week.
The breakout of this consolidation is nothing but “bullish” in the short-term and requires us to remove our hedge and allow portfolios to run unencumbered for the time being.
The great “bear market” of 2018 officially ended on Friday…for now.
As I have notated above, there are three possibilities for the market as we wrap up the “seasonally strong” time of the year.
- If the market can clear the previous high from mid-February then an advance to all-time highs is quite likely. (50%)
- The market fails to clear resistance, initially, at the mid-February highs, retraces back to the previous downtrend line (which will likely coincide with the 100-dma), completing a successful retest of the breakout and then moves to towards all-time highs. (30%)
- The market fails at mid-February resistance, tests support, and bounces, but fails at resistance a second time and begins a deeper correction. (20%)
As I have noted, I am giving the greatest odds right now to option (1) for the time being.
However, option (2) and (3) should not be dismissed either. On a longer-term basis, as I have noted previously, we still have fully registered sell signals. It will likely take a rally to old highs to reverse those “sell signals,” but with those signals at the highest level on record, there is likely a limit to a substantial upside advance.
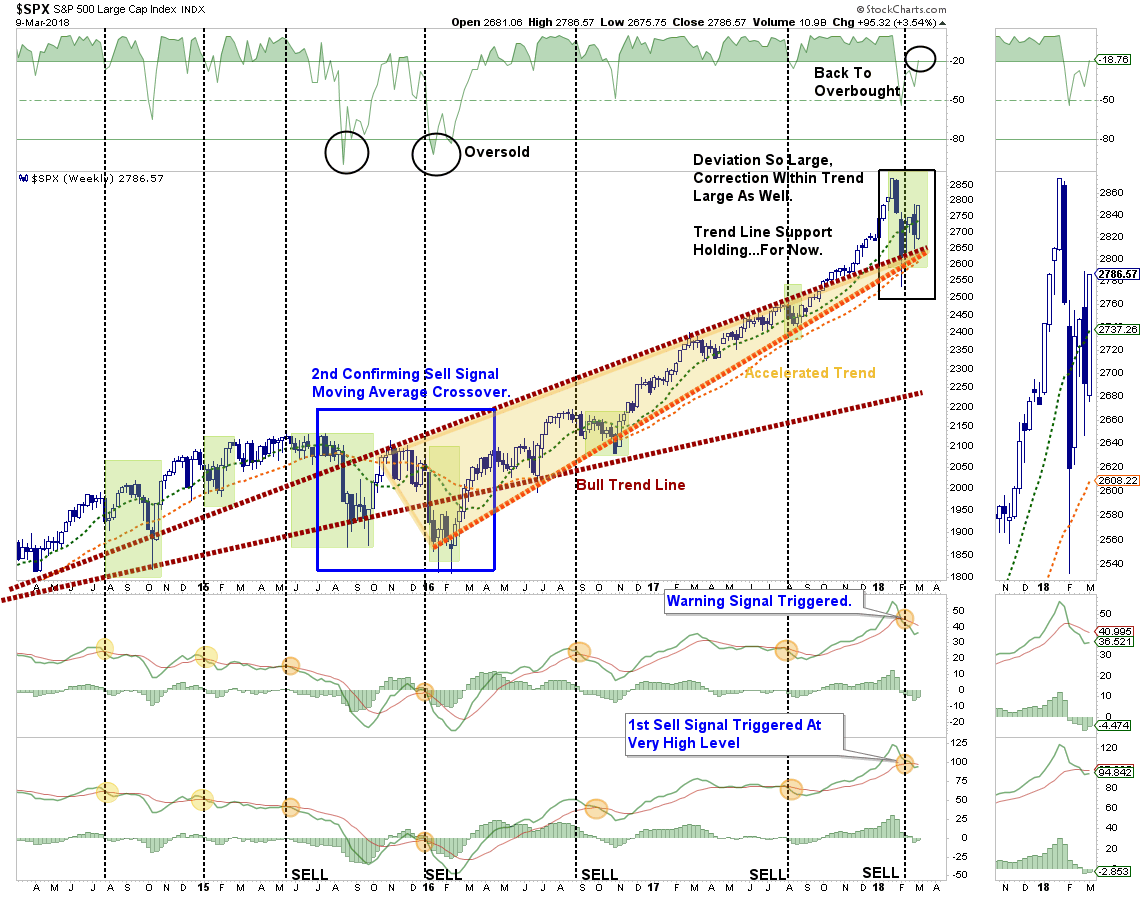
While these “sell signals” do NOT mean a “bear market” is about to commence, when they have been previously triggered at “high levels,” they have been good indicators of a short to intermediate-term topping process.
The question we should ask is:
“Was the February correction the ‘Bear Stearns’ moment for the market?”
The chart below is what happened in 2007 after “Bear Stearns” collapsed in February of that year.
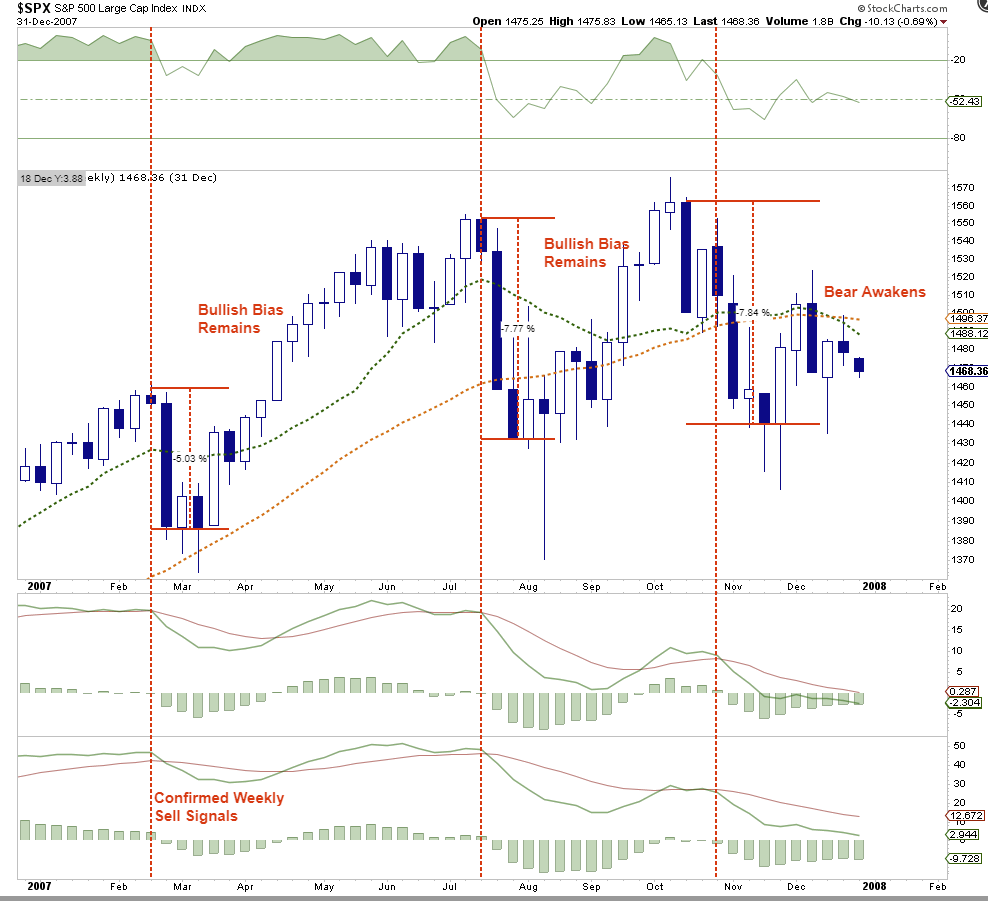
In 2007, the market was bullishly biased, we were in a “Goldilocks Economy,” and investors were giddy about future stock market prospects.
“It was different this time.”
The first crack in the market occurred in February as the market plunged 5% very quickly triggering a weekly “sell signal.” The market quickly recovered and set off to new highs reinforcing the “buy the dip” mentality. In July, the market cracked again, triggering a second “sell signal.” Once again, the market quickly recovered and surged to “new highs” further cementing the belief the bull markets were unstoppable.
It wasn’t. The “bear market” officially woke shortly thereafter.
Currently, as noted above, we have registered the first set of “sell signals” at historically high levels. Over the next few weeks, as we head into summer, it is quite possible we could set new highs. Even if that is the case, we will be watching for the following to determine if the current “bull market” is at risk:
- Current “sell signals” are reversed but then trigger again at lower levels.
- The “gap” between the long and short-term moving averages begins to narrow.
- Relative strength begins to have a negative divergence to the market.
Again, let me be VERY clear.
The “bullish trend” remains solidly intact. While ‘bearish signals’ are making an appearance, the market has done nothing in the short-term except complete a correction/consolidation process.
Such does not mean go jumping back into the market with reckless abandon. As I noted two weeks ago, when the market last made an attempt to head to new highs:
“There is a risk the market could reverse next week keeping prices confined within the bullish trend channel.”
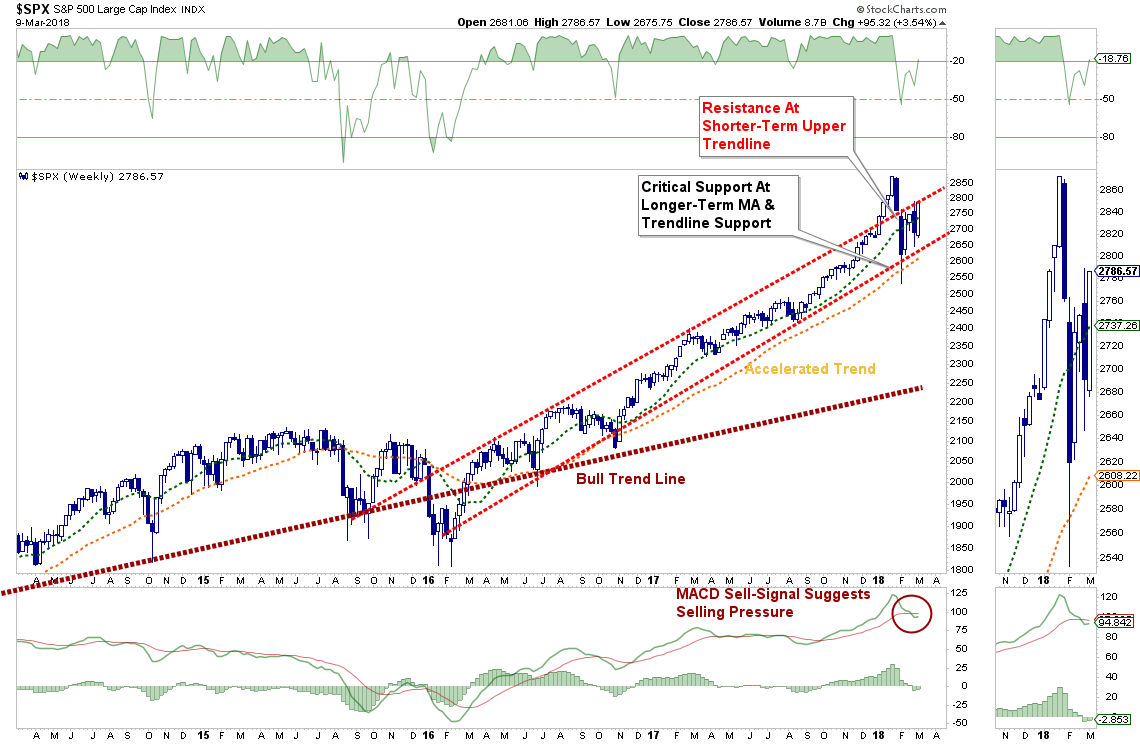
We are once again going to test that overhead bullish trend line next week.
A failure at the trend line will lead to a retracement, and retest of the breakout, setting up options (2) and (3) above.
Just for the record, while the short-term outlook is bullish, the long-term market backdrop remains decidedly bearish for equity investors. As I have shown before, on a long-term historical basis, the overbought, extended and overvalued conditions that are currently present in the markets have only existed at peaks of bull market advances.

However, in the short-term, the markets can certainly seem to deny the “laws of gravity” which encourages investors to take on far more risk than they realize.
Just remember, for every “bull market” there must eventually be a “bear.”
Chart Watch
by Jesse Colombo
On Thursday, I wrote a brief piece called “Watch These Triangle Patterns In Stocks And Crude Oil,” in which I showed chart patterns in those markets that likely indicated another major move upon a break-out from that pattern (either up or down). Here are the updated charts after Friday’s powerful surge in stocks and crude oil.
The SP500 successfully broke out of this pattern:
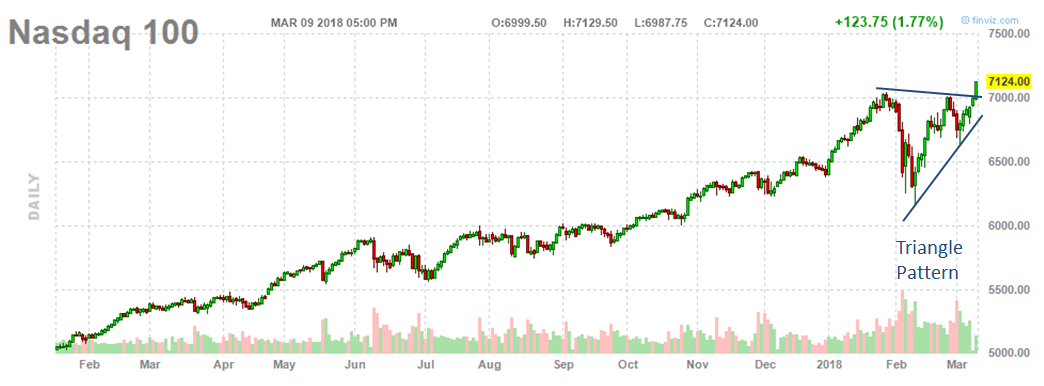
 The Nasdaq 100 also cleared its triangle pattern thanks to strong tech stock performance:
Unlike the stock indices, WTI crude oil hasn’t broken out of its triangle pattern yet, but did have a strong day on Friday (up 3.33%):
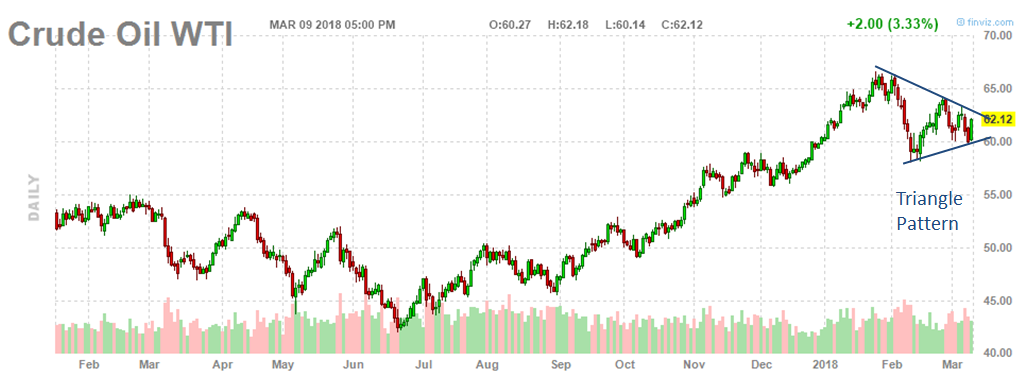 The technical picture certainly looks strong for now, and I am watching to see if there is follow-through next week (as confirmed by price and healthy volume). Also, it is important to beware of the risk of a head-fake after a breakout from such a perfect pattern as this. The “smart money” sometimes uses obvious-looking patterns like this to suck retail traders in, and then run the market in the opposite direction. I will continue monitoring the situation and providing updates.
Have a great week.
Market & Sector Analysis
Data Analysis Of The Market & Sectors For Traders
S&P 500 Tear Sheet
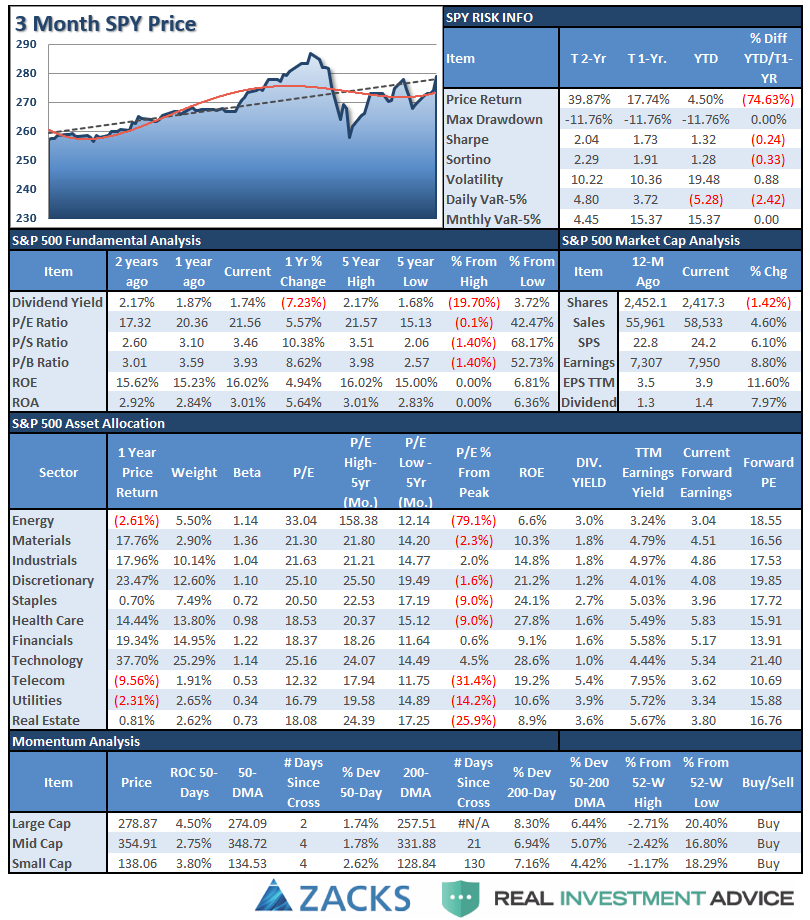
Performance Analysis

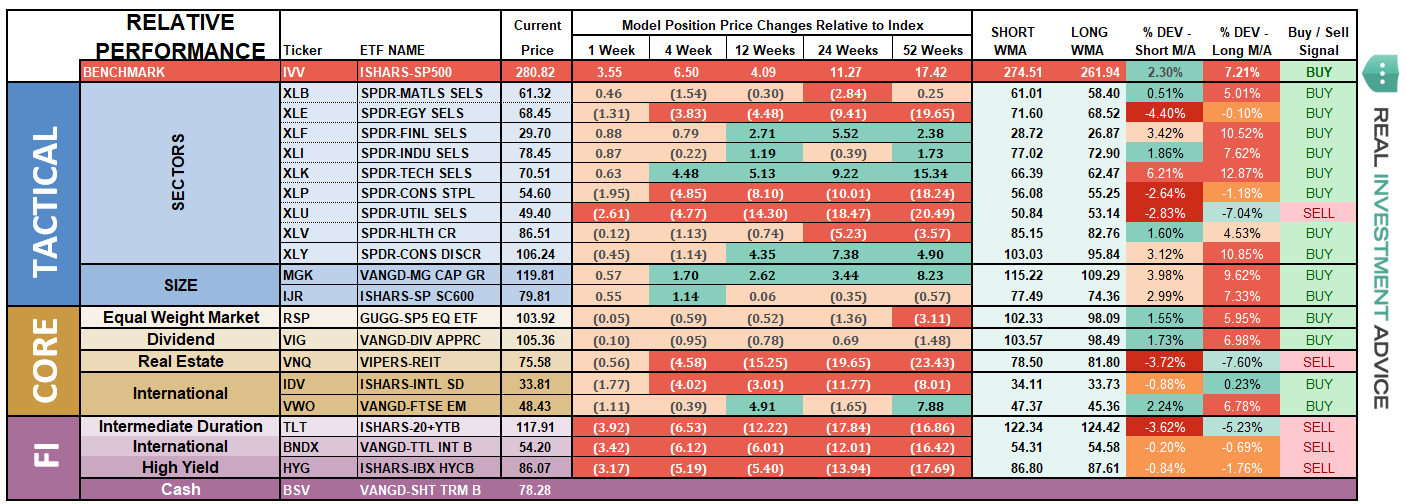
ETF Model Relative Performance Analysis
Sector & Market Analysis:
Two weeks ago, as the market struggled with its intermediate-term bullish trend line, I laid out two possible trajectories previously based on these support and resistance levels. I have updated the chart through Friday.
With the breakout above resistance, the “bullish bias” is back. However, we are watching the “sell signal” closely which has historically led to “false breakouts” in the past.
Let’s review sectors for opportunities.
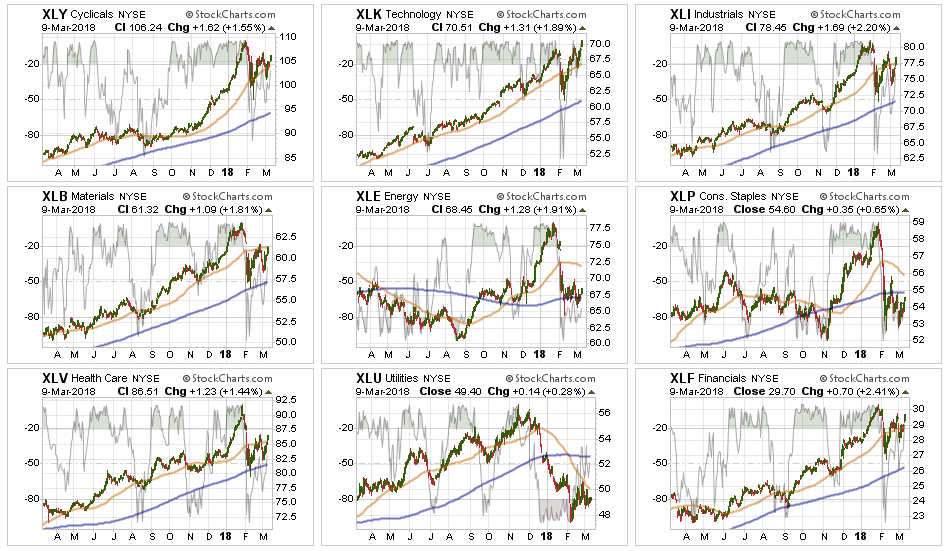
Discretionary, Technology, Health Care, Industrials, and Financials broke back through their respective 50-dma with Technology breaking out to an all-time high. Bullish trends remain clearly intact, and after having recommended taking profits and reducing weightings, these sectors are exhibiting the best relative strength. Use opportunity to add exposure to portfolios to bring sectors back up to portfolio weights.
Materials and Energy – we were stopped out of our small additional Energy trade with the break back below the 200-dma, and we closed out our Materials trade on potential “tariff” risk. I am going to write an update on oil here soon, but the bearish developments in oil suggest lower prices for energy-related stocks. We will remain neutral on the sectors for now.
Staples and Utilities have continued to underperform in recent weeks. With the sectors very oversold on a longer-term basis look for a potential rotation to reduce weightings in portfolios for now. I suspect the opportunity for these sectors to shine is coming as the realization of weaker economic growth and deflationary pressures become more visible, but that could be later in the year.

Small Cap, Mid Cap, Emerging Markets, Equal Weight, and Dividend indices all broke back through their 50-dma last week and led the charge on Friday. We reduced weights in international exposure due to the likely impact to economic growth from “tariffs” on those markets. Look for opportunities to bring these positions back to full portfolio weight on weakness that does not violate important support levels.
Gold broke back below its 50-dma last week and has recently put in a “double top” further reinforcing overhead resistance from last September. We currently do not have exposure to gold, but if you are already long the metal, the backdrop overall remains bullish but a correctional phase may be approaching so taking profits is likely wise.
Bonds and REITs over the last couple of weeks, these two sectors looked to have bottomed and initiated early “buy”signals. Hold positions for now as interest rates have started to recognize the economic weakness that has shown up in the data as of late.
Sector Recommendations:
(These are not recommendations or solicitations to take any action. This is for informational purposes only related to market extremes and contrarian positioning within portfolios. Use at your own risk and peril.)

Portfolio Update:
Last Friday, the market failed at the 50-dma for the week which required us to add our “short market hedge” back into portfolios. As stated then:
“The position is not a ‘bearish bet’ on the market, but rather a ‘volatility reduction’ of our portfolio longs.”
With the market breaking out solidly back above the 50-dma this past Friday we are taking the following actions:
- Remove the “hedge” from portfolios and allow portfolios to run unconstrained for now.
- We have adjusted portfolio model weightings slightly to adjust for current sector rotations. As noted above, we will look to reweight the following positions in portfolios opportunistically:
- Technology
- Discretionary
- Health Care
- Financials
- Small/Mid Caps
- We are also tweaking duration in our bond portfolios by adding a floating rate fund to the model and removing our small holding of high yield exposure.
While most positions still remain within their bullish tolerance bands, we are making minor tweaks to allocations while remaining well aware of the longer-term risks. Furthermore, we remain keenly aware of the intermediate “sell signal” that currently persists which keeps us focused on risk management and capital preservation.
THE REAL 401k PLAN MANAGER
The Real 401k Plan Manager – A Conservative Strategy For Long-Term Investors
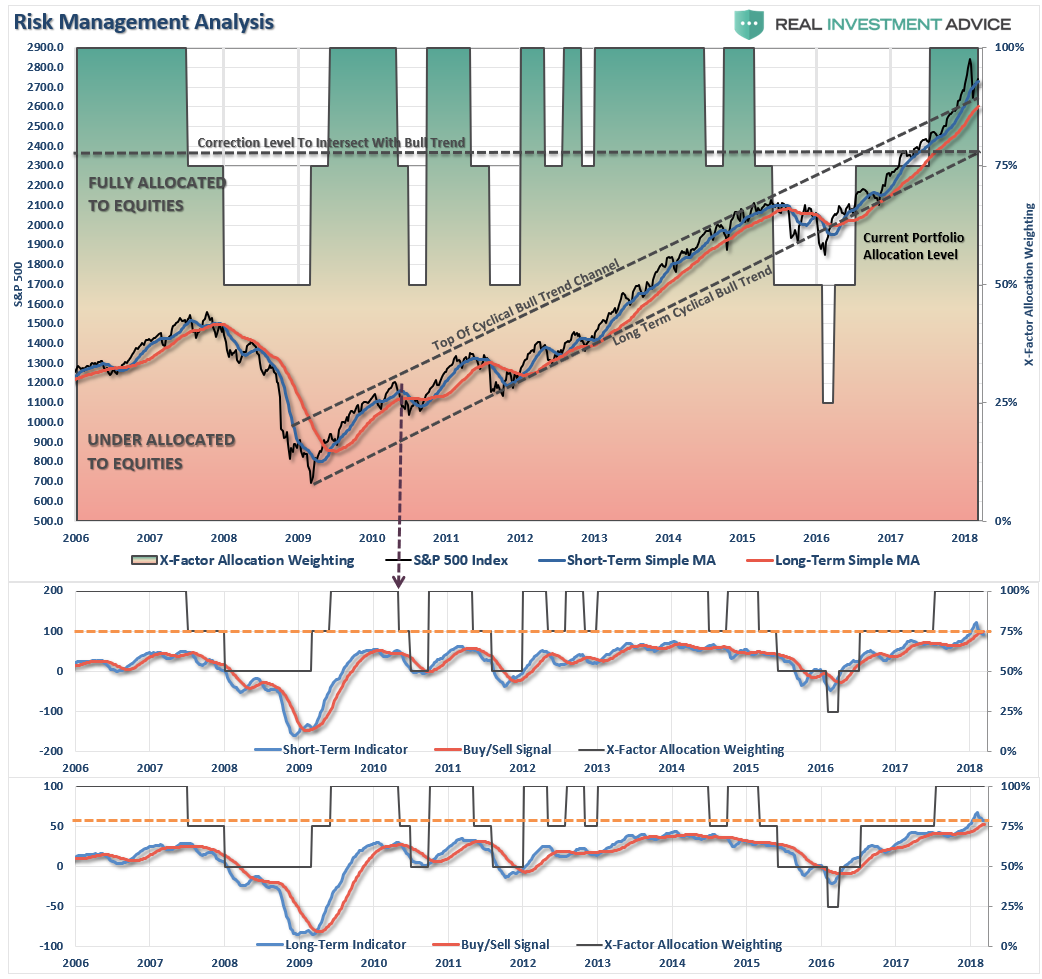
There are 4-steps to allocation changes based on 25% reduction increments. As noted in the chart above a 100% allocation level is equal to 60% stocks. I never advocate being 100% out of the market as it is far too difficult to reverse course when the market changes from a negative to a positive trend. Emotions keep us from taking the correct action.

Bulls Run But Warnings Remain
Last week I stated:
“The market changed this past week with the reversal of the recent rally. While the market remains confined to the bullish trend currently, the ‘warning’ signs have escalated over the past week.”
As I also stated:
“With the broader action of the market still bullish, we do not want to start making drastic changes as of yet. However, “alerts” have gone up and we are a bit more defensive now than previously. Continue to rebalance bond holdings back to target allocations but continue adding All NEW contributions to cash or cash equivalents.
If this correction completes, without violating any underlying bullish trends, we will use accumulated funds opportunistically to rebalance equity weightings. If the market violates the bullish narrative, we will begin reducing overall equity related exposure.”
Well, that is exactly what happened as the market broke out of its consolidation last week, confirming the bullish bias.
Rebalance portfolios this week to target allocations as shown below. The model below is just a “sample” allocation. Feel free to adjust the weights according to your own age, risk tolerance and goals.
Importantly, while the market is “bullishly biased” short-term, the longer-term picture of increased volatility, low-forward returns and capital destruction risks still prevail. If you near retirement, moderate your allocation accordingly to reduce the risk of loss.
If you need help after reading the alert; don’t hesitate to contact me.
Current 401-k Allocation Model
The 401k plan allocation plan below follows the K.I.S.S. principle. By keeping the allocation extremely simplified it allows for better control of the allocation and a closer tracking to the benchmark objective over time. (If you want to make it more complicated you can, however, statistics show that simply adding more funds does not increase performance to any great degree.)
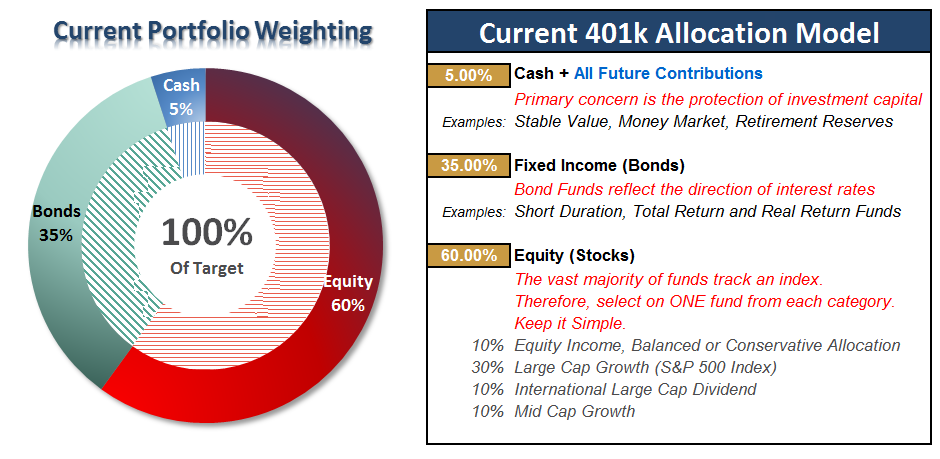
401k Choice Matching List
The list below shows sample 401k plan funds for each major category. In reality, the majority of funds all track their indices fairly closely. Therefore, if you don’t see your exact fund listed, look for a fund that is similar in nature.

Lance Roberts

Lance Roberts is a Chief Portfolio Strategist/Economist for Clarity Financial. He is also the host of “The Lance Roberts Show” and Chief Editor of the “Real Investment Advice” website and author of “Real Investment Daily” blog and “Real Investment Report“. Follow Lance on Facebook, Twitter and Linked-In