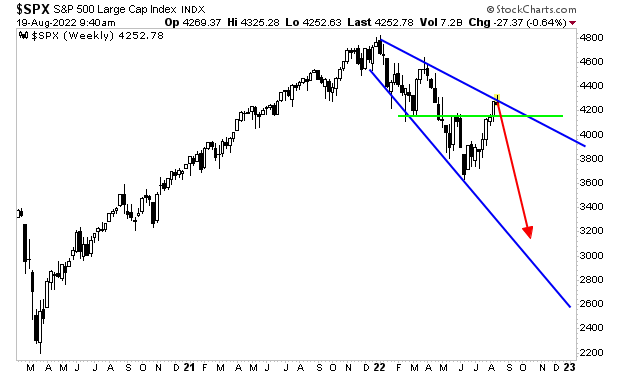
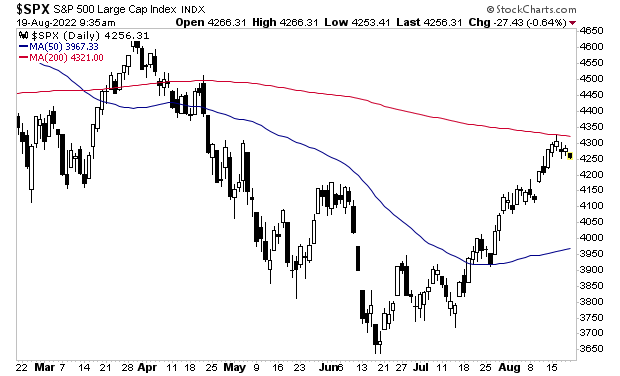
Judging from last week, the bear market rally ended right at the 200-day moving average (DMA) for the S&P 500.
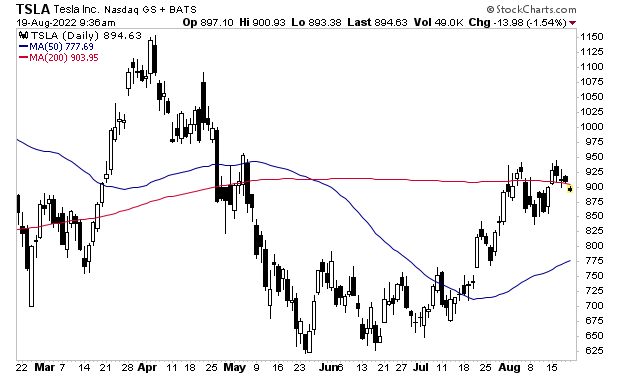
This was right where market leaders such as Tesla (TSLA) had suggested we’d see a top. Indeed, one of the first signs that the market would be topping out was the fact TSLA struggled to remain above its 200-DMA once it initially broke above that line in mid-July.
So where do we go from here?
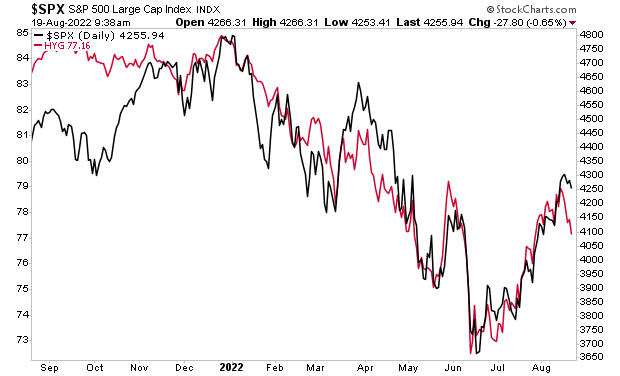
High yield credit, which leads stocks, suggests the S&P 500 is going to 4,100 in the near-term.
It’s a similar story for breadth, which also leads stocks.
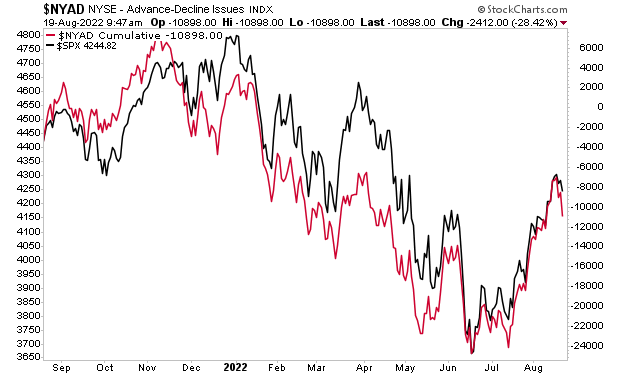
However, if the S&P 500 cannot maintain support (green line in the chart below) around 4,100, things could get UGLY fast.