Wolf Richter wolfstreet.com, http://www.amazon.com/author/wolfrichter
China’s corporations, the most indebted in the world, are forced to deleverage.
US “nonfinancial” corporate debt – this excludes debt by banks and by businesses that are not incorporated – rose to a record $15.2 trillion in the fourth quarter, according to data released by the Bank for International Settlements last week. To show how much of a burden this debt is, how it compares to other countries, and to eliminate the effects of inflation, the BIS also expresses this debt as a percent of nominal GDP. Given the growth of GDP in Q4, the ratio of corporate debt to GDP, at 74.4%, was unchanged from the upwardly revised Q3, and was down a tad from the record in Q2 of 74.9%.
The prior record of US corporate debt had been set in Q4 2008, at $10.7 trillion, as corporate debt had begun to unwind noisily, following the Lehman Brothers bankruptcy, and as GDP growth had turned sharply negative. In Q4 2018, corporate debt in dollar-terms was 42% higher than at the prior peak in Q4 2008. When measured as a percent of nominal GDP, the peak in Q4 2008 was 72.5% of GDP. And we’ve got that already beat by nearly two percentage points:
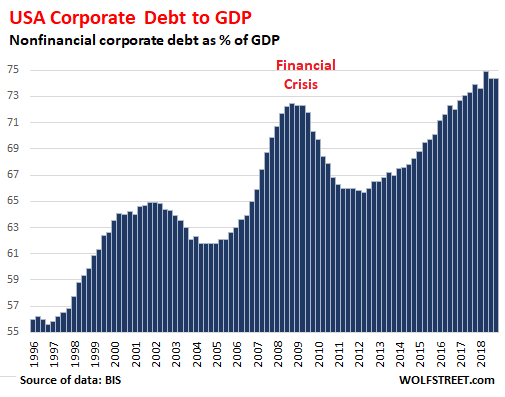
Corporate debt is high enough to be featured in the Fed’s Financial Stability Report at the top of the list of factors that might trigger the next financial crisis.
To compare the burden of debt levels from country to country, the BIS uses a country’s corporate debt as percent of nominal local-currency GDP. By this measure, and compared to all the debt sinners out there, the US is nevertheless only in a lowly 24th place.
All eyes are glued on China’d Corporate Debt
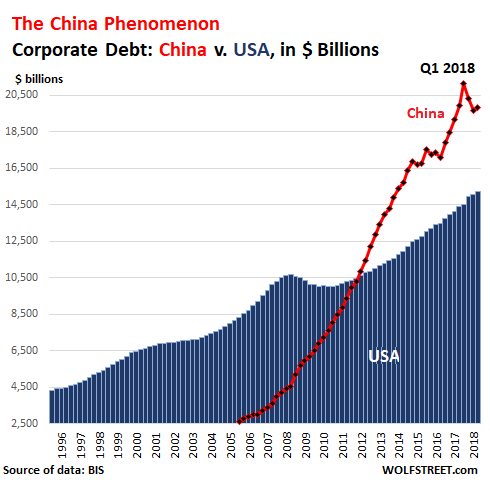
China, a smaller economy than the US economy, has by far more nonfinancial corporate debt: In US dollar terms, corporate debt in China hit a record of $21.1 trillion in Q1 2018, by far the most of any country. But since then, Chinese companies have been deleveraging under the orders from the central government. Deleveraging takes many forms in China, including defaults, state-mandated loan-to-equity swaps by Chinese state-owned banks, and bailouts by the central government, which includes the PBOC.
In Q4, 2018, China’s nonfinancial corporate debt (red line) was $19.8 trillion, with efforts to deleverage in Q4 having taken a backseat to efforts to boost the economy:
Among the major economies, China’s corporate-debt-to-GDP ratio is in a realm of its own. But there are some small economies with special tax laws and corporate tax-haven status that US, European, or Chinese corporations find attractive – and they have even higher corporate-debt-to-GDP ratios than China (we’ll get to those in a moment).
China’s efforts to deleverage its corporate sector, and the growth in its official GDP, have been reducing the corporate debt-to-GDP ratio from a peak of a blistering 162.6% in Q1 2016 to 151.6% in Q4 2018, still about twice the US ratio. In this chart and all charts below, the US debt-to-GDP ratio is added as a red line for comparative purposes:
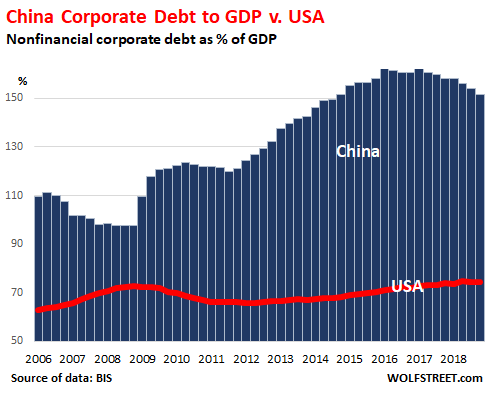
Compared to all countries, including favorite tax havens and off-shore centers for corporations, China’s astronomical level of 151.6%, though twice as large as the US ratio, lands China in only 7th place! So here we go….
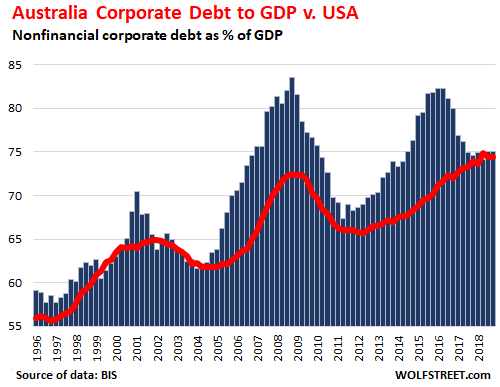
#23: Australia corporate debt-to-GDP ratio: 75.0%
Just barely ahead of the US, Australia’s corporate debt-to-GDP ratio has gone through bouts of leveraging. This is rather quaint compared to Australia’s household-debt-to GDP ratio, mostly caused by mortgages that financed one of the most magnificent housing bubbles in the world that is now unwinding. The red line for the US ratio adds some perspective. As we go up the scale, and as the corporate debt-to-GDP ratio rockets higher country by country, this red line gets pushed lower and lower until it is just a little decoration at the base of the chart of the winner.
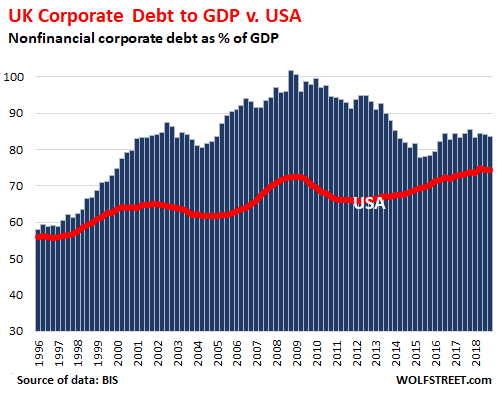
#22 United Kingdom corporate debt-to-GDP ratio: 83.6%
The UK debt-to-GDP ratio has been high for 20 years. It’s not that UK industrial companies borrow that much; it’s that the City of London is a tax haven for global corporations. But it has declined from 101% as the Global Financial Crisis broke loose:
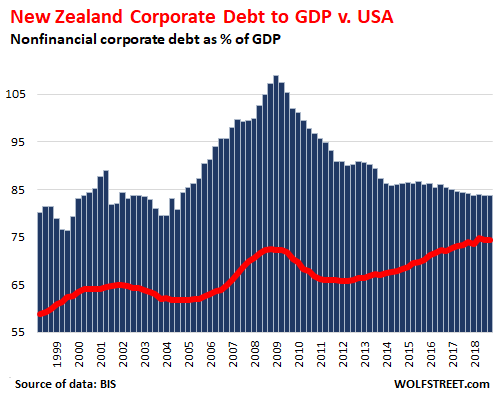
#21 New Zealand corporate debt-to-GDP ratio: 83.7%
New Zealand’s corporate world has deleveraged since the Financial Crisis, and never fully jumped back on the bandwagon, though debt levels remain much higher than in the US:
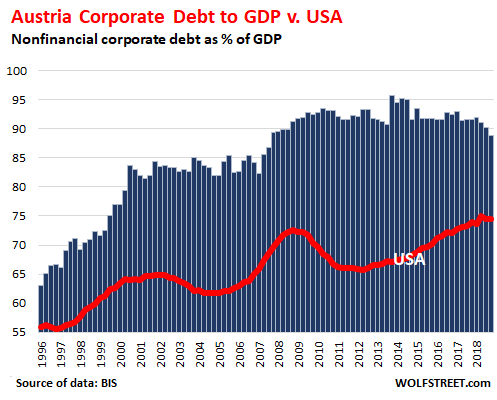
#20 Austria corporate debt-to-GDP ratio: 88.8%
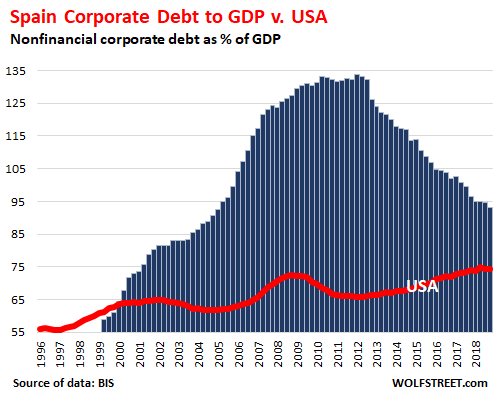
#19: Spain corporate debt-to-GDP ratio: 93.2%
Spain is what a chart of a real financial crisis looks like that followed a magnificent housing bubble and an over-indebted corporate sector that was concentrated on real estate and construction that ended in a brutal bust all around that took down the banks and triggered all kinds of bank bailouts and economic mayhem. And this deleveraging continued relentlessly through Q4 2018, with the ratio ticking down another half a percentage point from the prior quarter to 93.2%, though it remains very high:
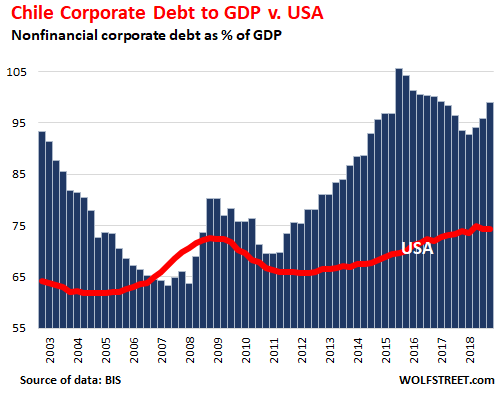
#18 Chile corporate debt-to-GDP ratio: 98.9%
Chile had begun to deleverage for a couple of years, after a phenomenal surge following the Financial Crisis. But in 2018, the debt-to-GDP ratio started jumping again and is now 34% higher than the US ratio (the BIS data for Chile only goes back to 2003):
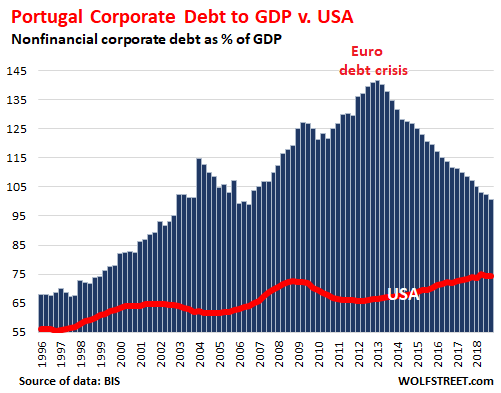
#17 Portugal corporate debt-to-GDP ratio: 100.6%
Portugal was one of the epicenters of the euro debt crisis after it had already had its own financial crisis, triggered in part by enormous amounts of cheap euro corporate debt: economic decline, pain, and forced deleveraging followed. But debt levels remain high, and there is still some deleveraging to do.
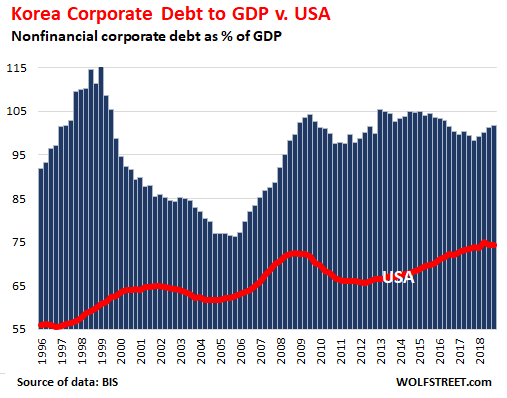
#16 South Korea corporate debt-to-GDP ratio: 101.7%
Note the effects of the buildup of debt in the 1990s that then ended in the Asian Financial Crisis that broke loose in 1997:
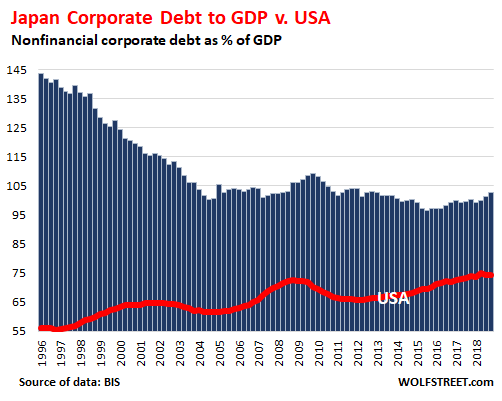
#15 Japan corporate debt-to-GDP ratio: 102.6%
Japan’s corporate sector spend over 15 years deleveraging. But debt levels remain high, and the debt-to-GDP ratio is growing again, and was 36% higher than the US ratio:
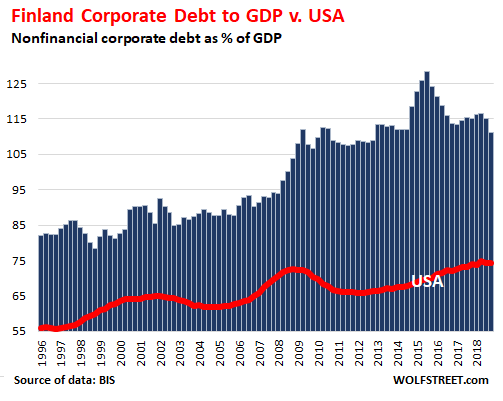
#14 Finland corporate debt-to-GDP ratio 111.3%:
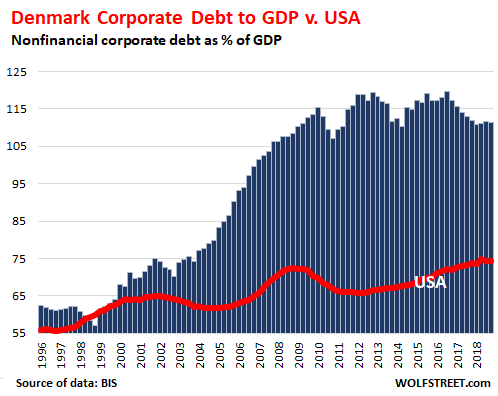
#13 Denmark corporate debt-to-GDP ratio: 111.3%
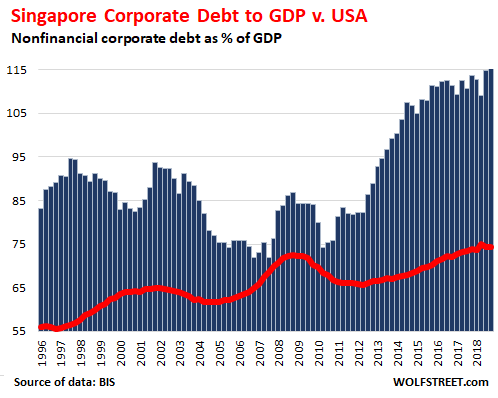
#12 Singapore corporate debt-to-GDP ratio 116.4%:
Singapore is one of the destinations for corporations and their debts from other countries, including China, and it shows in a debt-to-GDP ratio:
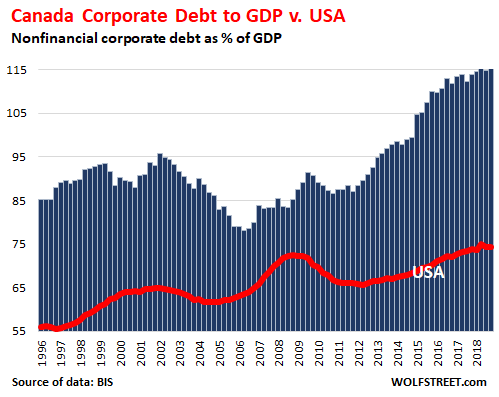
#11 Canada corporate debt-to-GDP ratio: 117.2%
The indebtedness of Canada’s household has become already legendary and ranks among the highest in the world. But so does Canada’s corporate sector.
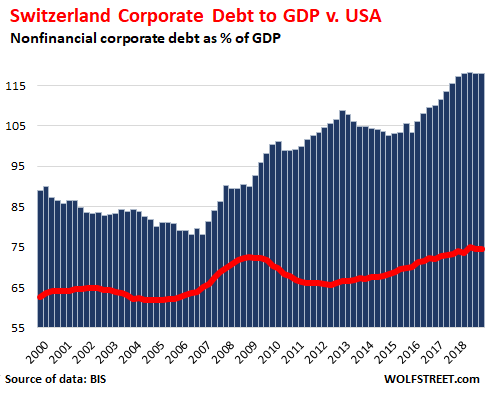
#10 Switzerland corporate debt-to-GDP ratio 118.1%:
OK, time to get dizzy. Switzerland is a corporate tax haven, and some Swiss companies are very large global M&A meisters, with some of their debts in Switzerland. In addition, Switzerland is steeped in NIRP where high-grade companies can borrow for just about free:
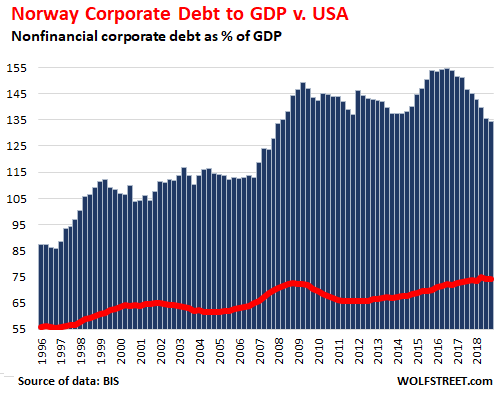
#9 Norway corporate debt-to-GDP ratio 134.4:
If Norway has a financial crisis, not a lot of people outside Scandinavia will notice. The economy of Norway is just too small. That’s the good thing. But lordy, there sure is a lot of corporate debt:
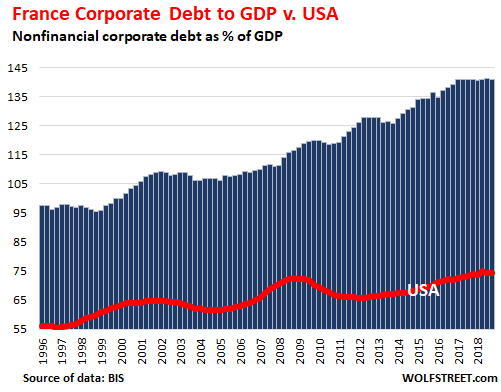
#8 France corporate debt-to-GDP ratio 141.0%:
The French corporate sector is dominated by enterprises that are either wholly or partially state-owned and that used to be wholly state-owned and have enormous amounts of debt that is assumed to be backed by the French state. Hence a debt-to-GDP ratio of Chinese proportions:
#7 China corporate debt-to-GDP ratio 151.6%:
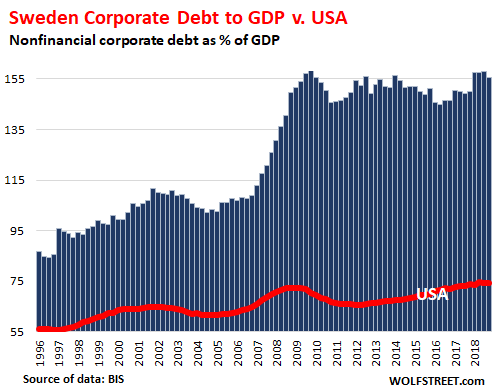
#6 Sweden corporate debt-to-GDP ratio 155.5%:
Another NIRP country — the wonders that are performed by NIRP, ZIRP, and very low interest rates. By comparison, the US ratio seems outright minuscule:
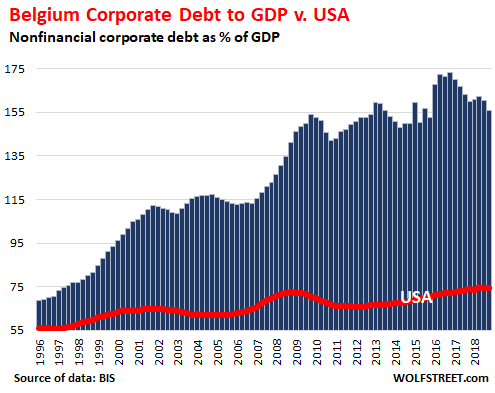
#5 Belgium corporate debt-to-GDP ratio: 155.9%
A role in this debt pileup can be ascribed to beer M&A, the debt that comes with, along with the hangover.
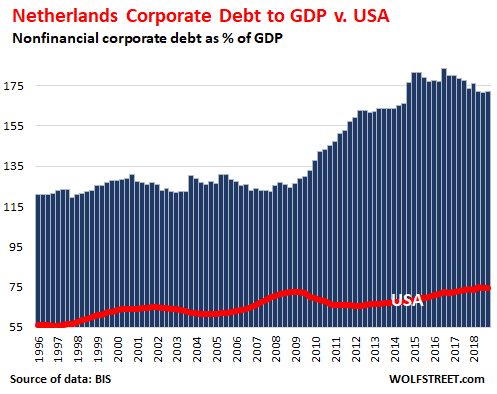
#4 Netherlands corporate debt-to-GDP ratio: 171.9%
A place for corporate tax avoidance specialists to shelter income and register their debts.
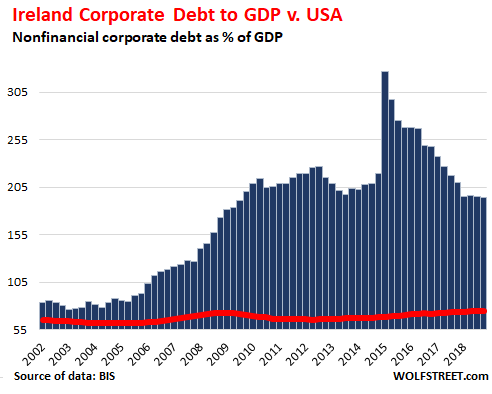
#3 Ireland corporate debt-to-GDP ratio: 194.6%
Ireland is where US corporations go to shelter their income via mailbox operations or even a corporate tax inversion where the US company ends up being headquartered in Ireland via a merger. This is a big thing for Big Pharma, such as Allergan, which generates most of its sales in the US, but was formed in 2015 when Irish–registered Actavis acquired the much larger US company, which caused the spike in Ireland’s corporate debt-to-GDP ratio that year. Actavis was itself a US company that did a tax inversion in 2013 to become, for tax purposes, Irish. These companies have some operations in Ireland but didn’t actually move to Ireland. But some of their corporate debt shows up in Irish data — instead of in the US data. Hence, the absurd chart:
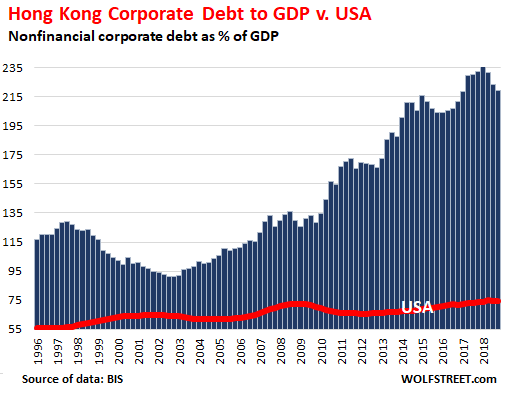
#2 Hong Kong corporate debt-to-GDP ratio: 219.4%
When it comes to corporate finances and international trade, Hong Kong and China should be added together.
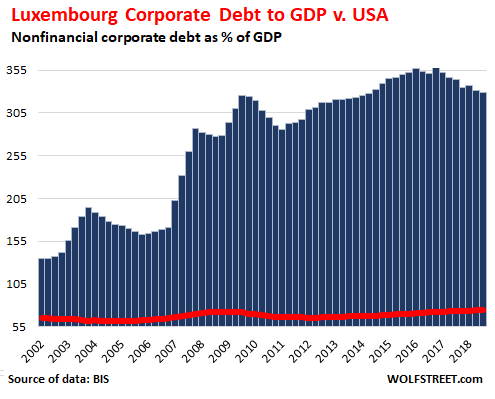
#1 Luxembourg corporate debt-to-GDP ratio: 318.7%
No country comes even close to Luxembourg. Its corporate debt-to-GDP-ratio is over four times that of the US. The country is a choice location to set up headquarters for tax-dodging global companies. This includes steel giant ArcelorMittal, satellite services companies SES and Intelsat, intercontinental airfreight company Cargolux, and “internet giants Amazon, Skype and Paypal,” brags the Luxembourg office of KPMG, which offers to set up and manage such mailbox headquarters: