Authored by Pater Tenebrarum via Acting-Man.com,
Credit Market Bifurcation
By all accounts, credit markets remain on fire. 2019 is already a record year for corporate bond issuance, beating the previous record set in 2017 by a sizable margin. Demand for the debt of governments and government-related issuers remains extremely strong as well, despite non-existent and often even negative issuance yields. Even now, with economic activity clearly slowing and numerous threats to the post-GFC recovery looming on the horizon, the occasional rise in credit spreads is routinely reversed. And yet, under the placid surface problems are beginning to percolate. Consider exhibit A:
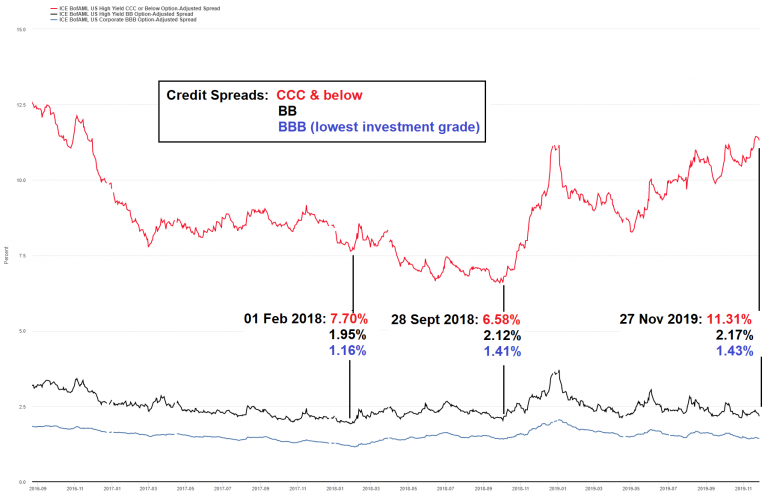
The chart shows option-adjusted credit spreads on three rating categories – while spreads on ‘BB’ rated (best junk bond grade) and ‘BBB’ rated (weakest investment grade) bonds remain close to their lows, spreads on ‘CCC’ rated bonds continue to break higher – considerably so. An increase by 473 basis points from their late 2018 low indicates there is quite a bit of concern.
It is actually rare for credit spreads on these rating classes to drift apart to such a significant extent at a time when spreads on better-rated bonds are still close to their lows. Normally the exact opposite happens – when spreads are tightening, they also tend to tighten between the different rating classes – only when spreads are widening across the board will spreads on lower rated bonds display a tendency to widen to more rapidly than those on better-rated ones.
This bifurcation is actually a subtle warning indicating that the credit cycle may finally be coming to its end. It is “subtle” in the sense that it is generally not yet perceived as a sign that trouble is brewing – rather, it is dismissed as a sign that bond buyers have become slightly more selective (a good thing). In view of a record year for corporate bond issuance it is probably not surprising that concern remains muted.
To be sure, high yield defaults remain very low – and while they are forecast to increase, a major surge in defaults is currently not expected. However, these superficially placid conditions are masking growing turmoil – as so often, the devil is in the details. Consider the following data point released by S&P in mid October:
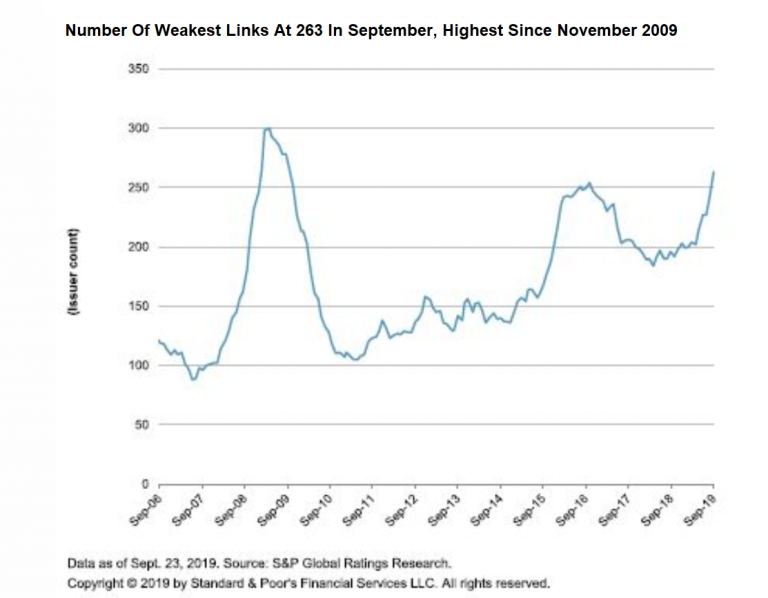
According to S&P the number of “weakest links” is at a level last seen in November of 2009, when the speculative-grade default rate stood at 10.5%. This is an astonishing datum, to say the least.
Weakest links are defined as issuers rated ‘B–’ or lower by S&P Global Ratings with negative outlooks or ratings on credit watch with negative implications. As S&P helpfully explains:
“The default rate of weakest links is nearly eight times greater than that of the broader speculative-grade segment, and the rise in the weakest links tally may signify higher default rates ahead.”
Readers may be surprised to learn that contrary to 2015-2016, oil and gas companies are not leading the pack – consumer products companies are (52 issuers or ~20%). Energy companies are in second place, representing around 10% of the total, followed closely by media companies and restaurant chains.
All of these sectors are held to be under pressure due to industry-specific problems, but that doesn’t change the fact that a great many companies have obviously over-leveraged their balance sheets. The growth in “weakest links” in the strongest developed economy is testament to the proliferation of zombies central bank policies have created in recent years.
S&P nevertheless expects the US junk bond default rate to reach a mere 3.4% over the coming year, which is actually still a fairly benign number. Presumably this is not factoring in the possibility of a recession. It seems to us there is a substantial risk that this forecast will be subject to upward revisions as time goes on.
Leveraged Loans, Private Equity and Banks
In recent years enormous amounts have poured into private equity and venture capital funds. Not surprisingly, the rising popularity of unlisted alternative investments (read: illiquid investments) has made it more difficult for them to deliver the large returns that initially attracted investors. Leveraged loans play an important role in private equity buyouts – but recently the situation in leveraged loan land has deteriorated noticeably. Here is a brief summary from Almost Daily Grant’s, a publication of Grant’s Interest Rate Observer:
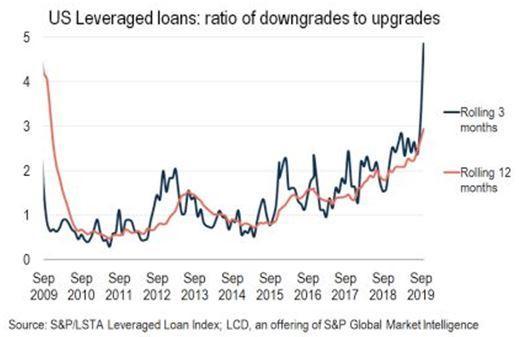
“Signs of trouble abound. According to S&P’s LCD unit, 282 issuers within the S&P/LSTA Index suffered a rating downgrade in the year-to-date through Oct. 11, up from 244 for all of last year and just 33 in 2017. That has pushed the proportion of leveraged loans rated triple-C (“In the event of adverse business, financial, or economic conditions, the obligor is not likely to have the capacity to meet its financial commitments on the obligation.”) to 7.5% of loans outstanding at the end of September, according to S&P. That’s the highest level since 2013 and up from 6.3% in June. Needless to say, the increasing prominence of private equity in tandem with a cyclical credit deterioration presents a delicate backdrop.”
The ratio of loan downgrades to upgrades has soared
The growth in private equity (PE) AUM has increased buyouts of listed companies and pushed up the prices at which they are done (the result of too much money chasing deals), but now the strategy is running into a problem: monetizing these investments has become increasingly difficult. Fewer and fewer deals are making it to the IPO stage, which is – apart from saddling the targets with debt so they can make large dividend payments – the main goal of PE investments.
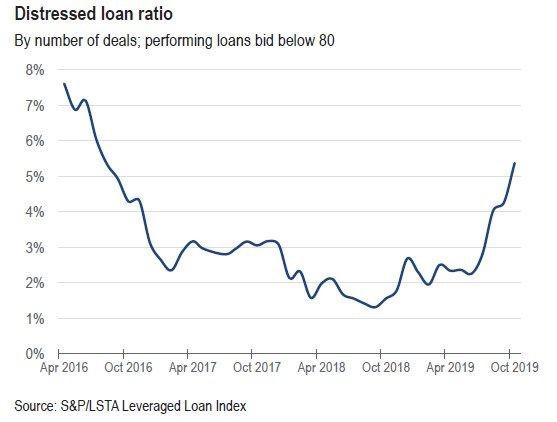
The percentage of distressed leveraged loans is on a strong upswing as well – note that the high levels in 2016 coincided with a raft of bankruptcies in the energy sector in the wake of the 2014-2016 oil price collapse.
As noted above, leveraged loans have become a favored form of debt in PE buyouts, and lately a number of deals either did not get done at all, or only after major concessions were made. This makes it more difficult to bear the debt and lowers the prospective returns of PE investments. Grant’s again:
“Higher price tags figure prominently in the downshift in return expectations. S&P’s LCD unit reports that the average U.S. leveraged buyout carried a purchase price equivalent to 12.9 times Ebitda in the third quarter to bring the year-to-date average to 11.5 times. That’s up from 10.6 times Ebitda last year and 9.7 times in 2007. But, the actual valuation expansion might be far higher, as a Sept. 19 report from S&P Global found that so-called add-backs (i.e. applying hypothetical future cost-savings today) represented 49% of reported Ebitda at deal inception.
Those increasingly fancy valuations (along with abundant use of the financials-flattering add-backs) coincide with rising debt burdens. A Nov. 21 research note from Morgan Stanley found that 57% of companies which have undergone an LBO carry net leverage above six times Ebitda. That’s up from 51% in 2007. With rising encumbrance comes an increased risk of impairment, as a survey of p.e. lenders from research firm Credit Benchmark suggests a 6% default probability for leveraged loans issued by private equity-owned firms, up from 5.44% a year ago and well above the 2.36% default likelihood of leveraged loans from their publicly-traded counterparts.
Meanwhile, the blistering rally in asset prices this year has provided little support for the ranks of leveraged loan issuers, with cash flow coverage falling to 3.1 times interest expense in the third quarter according to LCD, down from 3.6 times at year-end 2018 and the weakest coverage since at least the third quarter of 2016.”
There may be a period of regret on the way for investors in private equity. However, the risks posed by leveraged loans are more broadly distributed. In fact, they are systemic.
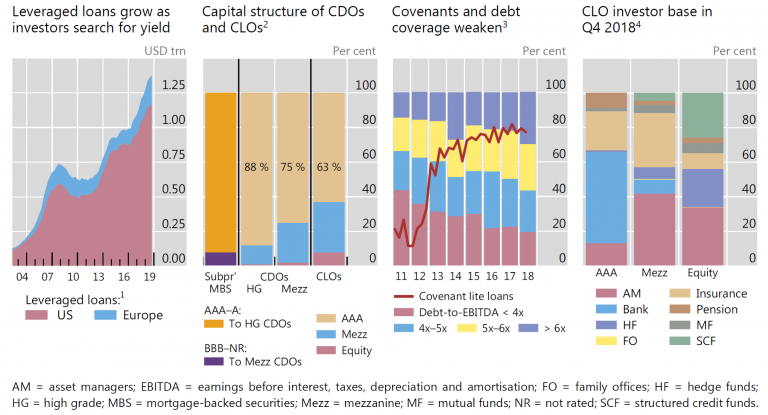
Leveraged loan data from the BIS, published mid-year – leveraged loans are packaged in CLOs, which attract a broad range of investors due to the yield pick-up they offer. The more capital has rushed into this segment over the years, the more debt covenants and debt coverage have deteriorated.
Leveraged loans are not only important for the PE business, they are also sold to various institutional investors packaged as CLOs (collateralized debt obligations). The banks that create these CLOs in turn are themselves major holders of leveraged loans and CLO tranches. Typically banks will hold the senior tranches, which are the least risky – but we would point out that many “AAA” rated senior tranches of CDOs and CMOs ultimately failed to protect investors when the housing bubble faltered in 2007-2008.
After all, the high ratings of the senior tranches of CLOs and similar structured products are not based on the ratings of the underlying loans, but on overcollateralization and the seniority feature. In 2007-2008 neither of them was sufficient. As a financial stability report published by the BoE informs us:
“Banks originate leveraged loans, a large share of which they distribute to non-bank investors including to collateralised loan obligations (CLOs) for securitisation. In total, banks retain exposures to over half of the leveraged loan market through loans that they have originated but not yet distributed (‘pipeline exposures’), loans they choose to retainon their balance sheets and CLO holdings.
The share of new leveraged loan issuance with no maintenance covenants has more than tripled since 2007, and remains close to record highs globally at almost 60% in 2019. Other traditional investor protections in loan terms have also been relaxed (such as restrictions on borrowers’ ability to transfer collateral beyond the reach of the lender), potentially increasing losses to lenders in the event of default. Borrowers are also increasingly indebted globally, with the average reported debt to EBITDA ratio of the borrowers issuing new leveraged loans around levels observed in 2007. There has been growing use of adjustments (‘add-backs’) to how earnings are calculated at the point a loan is made, which could further understate leverage. Add-backs and subsequent borrowing are typically not captured in public measures of leverage and if included leverage is likely to be above 2007 levels. For example, PRA supervisory data indicate that the share of new lending with leverage above seven times would increase from 18% to 28% if these were included.
Banks’ loan book exposures are mainly through revolving credit facilities (effectively overdrafts) and, to a lesser extent, holdings of term loans. Together they account for around 47% of the total leveraged loan market. Banks’ exposures through holdings of typically senior tranches of CLOs account for around 9% of the total leveraged loan market.
Many banks also have indirect exposures via facilities to credit and private equity funds which invest in leveraged businesses. Some banks also offer warehousing facilities, which are loans to CLO managers to finance the setting up of their CLOs.
Total direct and indirect exposures for some international banks active in this market are significant. For a sample of global systemically important banks (G-SIBs) active in this market, their exposure is on average around 75% of common equity Tier 1 (CET1) capital. Banks could face the risk of credit and mark-to-market losses on these exposures.”
(emphasis added)
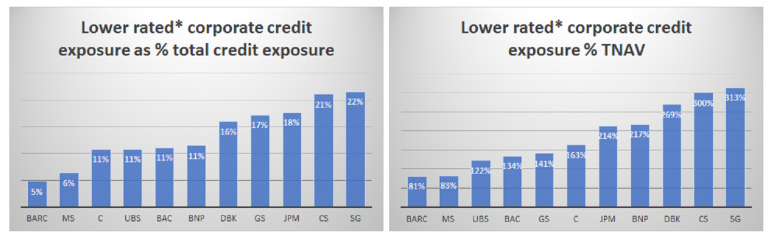
Exposure of 75% of CET-1 capital is not exactly chickenfeed. Any significant deterioration in leveraged loans will force banks to get rid of some of their exposure in order to remain in compliance with the strict post-GFC Basel III capital adequacy requirements. This would put greater pressure on prices, forcing even more deleveraging.
Leveraged loan exposure of several systemically important banks – as a percentage of their total credit exposure as well as of their tangible net asset value
Below are a few more charts illustrating the growing risks in leveraged loans. The first one depicts the recent deterioration in leveraged loan prices in a more granular manner. It also includes the effect of the slump in the oil patch from 2014 to 2016 in full:

Percentage of leveraged loans priced below 90 and below 80. The recent rise is reminiscent of the beginning of the 2014-2016 mini-crisis
The next chart is from the BoE and shows that the proportion of corporate borrowers with a net debt/EBITDA ratio in excess of 4 has increased to levels last seen in 2007. Keep in mind that this does not reflect the above mentioned “add-back” effects, which lead to lower ratios being reported on the basis of estimated or planned future improvements (i.e., imaginary figures). The BoE report this chart was taken from was published in mid-year so it is reasonable to assume that the situation has worsened further since then.

Net debt/EBITDA essentially indicates how many years it would take to pay back a company’s debt based on its current debt levels and income. Note that the chart includes only listed non-financial companies and does not include real estate, energy and mining companies. If the latter were included, the figures would look worse.
The next chart shows the distribution of leveraged loans by rating classes and how many loans have found their way into CLOs. The largest share is taken up by loans rated ‘B’.

Leveraged loans by rating classes and how many are packaged in CLOs
And lastly, we have noticed that despite the fact that leveraged loan investors are generally considered to be quite sophisticated, such loans are in practice often re-priced quite suddenly – which is to say, investors were surprised by adverse developments befalling the borrowers. Two such re-pricing events are shown below, one of a Clover term loan and a more recent one of a Party City term loan due in 2022 that was only issued last year (Party City conducted aggressive share repurchases and was reportedly also quite adept at the EBITDA add-back game).
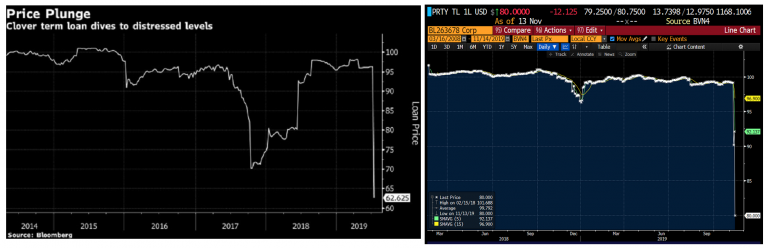
Leveraged loans falling prey to sudden re-pricing
Conclusion
To sum up, there are growing signs of distress in certain forms of high-yield debt. As long as default rates remain low, this is not perceived as a big problem, not least in view of the fact that the market recovered quite smartly from the 2014-2016 downturn. However, as we previously reported, a veritable wall of maturities is looming in high-yield debt in the years 2020-2024.
This means that many of the so-called “zombie” companies that can only survive by constantly refinancing their debt will depend on investors continuing to “chase yield” with abandon. The strong demand for new debt issuance seen this year will have to continue or become even stronger. Central banks across the world are once again pursuing looser monetary policy, which supports this process. Despite this, global liquidity conditions actually remain relatively tight so far, which implies that economic activity is likely to slow further. The probability that the party may be ending is clearly rising.
* * *
Addendum: CDOs in 2007 vs. CLOs in 2018
A table from the BIS that compares several features of CDOs in 2007 to CLOs in 2018:

This is probably not going to make anyone feel better about the risks posed by CLOs.