After last week’s powerful sell-off, the U.S. stock market opened much higher this morning, with the Dow up as much as 352 points. Mainstream investors and TV commentators were excited, as they usually are, that the sell-off may have created an excellent “dip-buying” opportunity. I wasn’t buying it one bit, however:
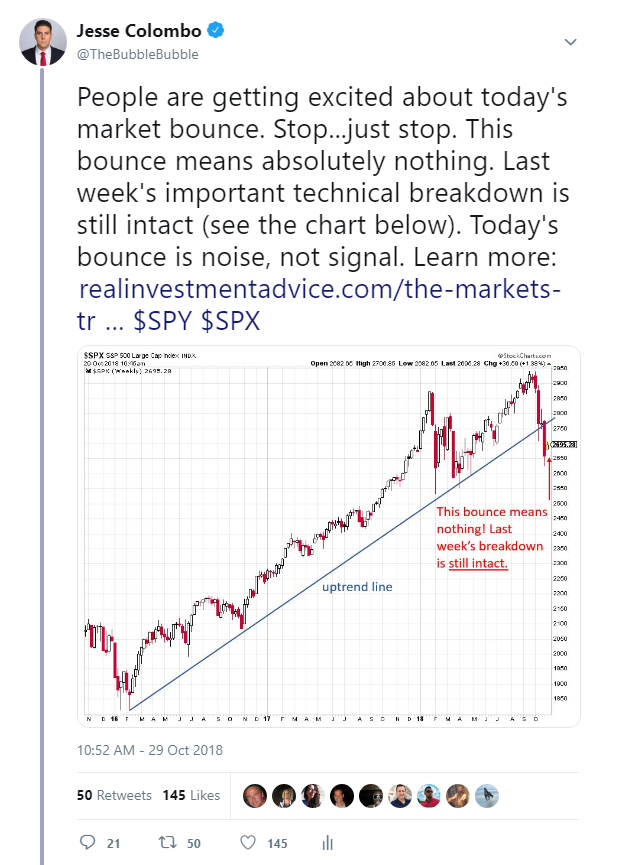
Last week, I wrote that “the market’s trend breakdown had been confirmed” because the U.S. market closed below its important uptrend line that began formed in early-2016. In my mind, this morning’s market pop was nothing to get excited about because the U.S. stock indices were still below their important trendlines (which are now resistance levels), which means that last week’s technical breakdown was/is still intact.
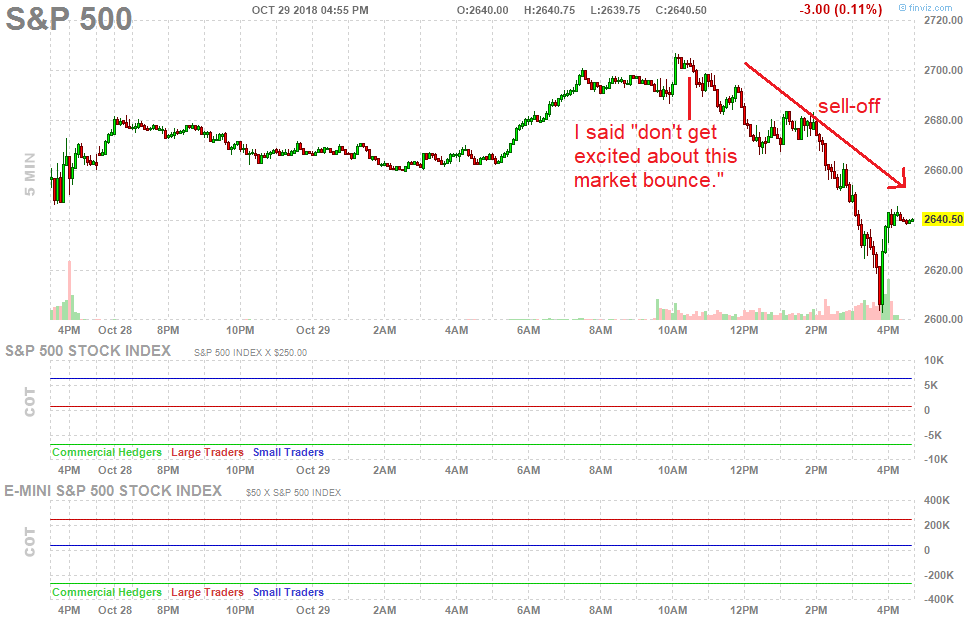
Shortly after my statement, the market erased its gains in one of the worst intraday reversals in years:
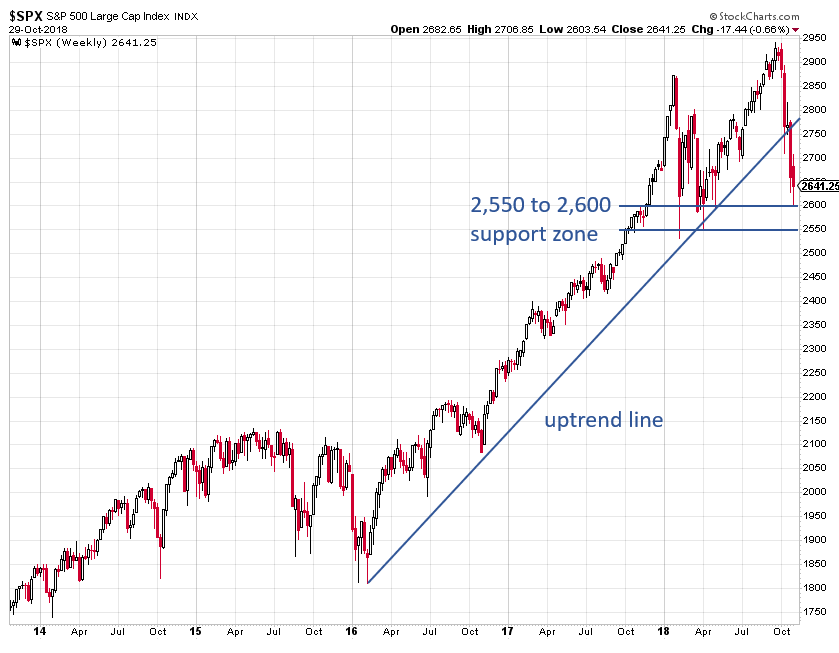
The sell-off of the last few weeks caused the S&P 500 to break below its uptrend line that began in early-2016. The next major technical support and price target to watch is the 2,550 to 2,600 support zone that formed at the lows earlier this year. I don’t expect to see much of a bounce until this zone is tested a bit more (the market may need to test the lows of this zone around 2,550).
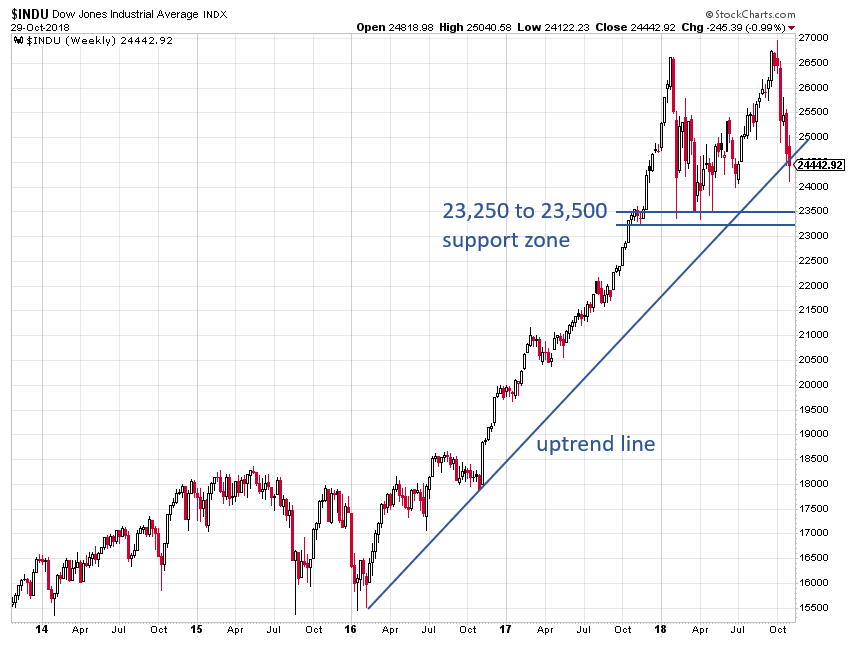
At the close of trading last week, the Dow Jones Industrial Average still had not broken below its key uptrend line yet, unlike the S&P 500, Nasdaq Composite, and Russell 2000. As of today, however, the Dow closed below this uptrend line, which is a worrisome sign. I would like to see a close below this line on the weekly chart for further confirmation.
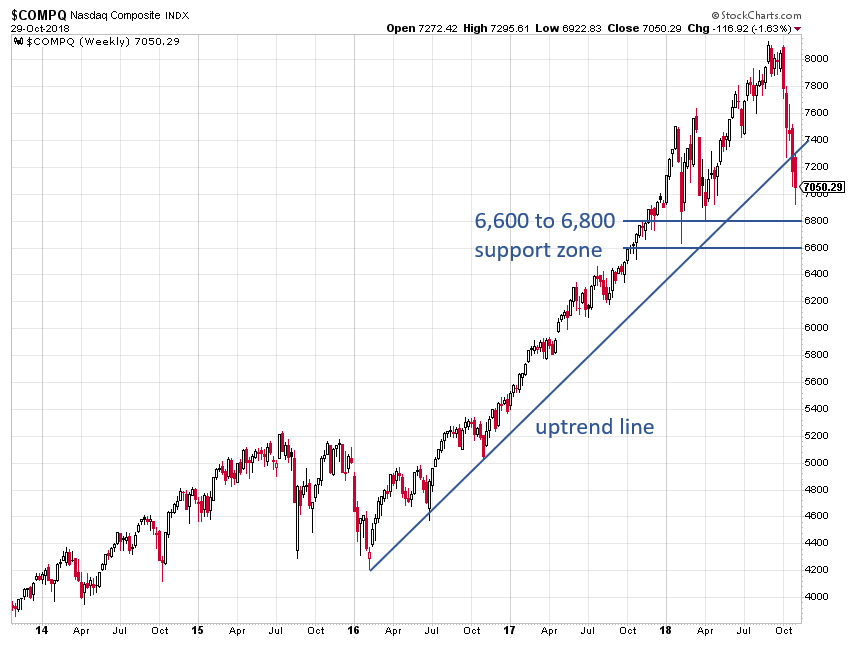
The Nasdaq Composite index continues to fall hard after closing below its uptrend line that began in early-2016 last week. The index will likely gun for its next price target, which is the 6,600 to 6,800 support zone that formed earlier this year. I don’t foresee much of a bounce until the Nasdaq has tested this zone.
The small cap Russell 2000 index broke below its uptrend line three weeks ago and has been testing the 1,475 support level. If the index breaks below the 1,425 to 1,475 support zone, it would give yet another bearish signal.

I don’t expect much of a bounce until the respective U.S. stock indices test their early-2018 lows, which means that the markets are likely to go even lower in the short-term. Even if/when we get a bounce, it’s not much to get excited about because it is likely to only be a short-term technical bounce or relief rally rather than a sustainable phase of the bull market. I have been warning that we are in a dangerous stock market bubble (please watch my presentation to learn more), so the breakdown of the past few weeks means that the stock market bubble is in the process of popping – a very scary prospect.