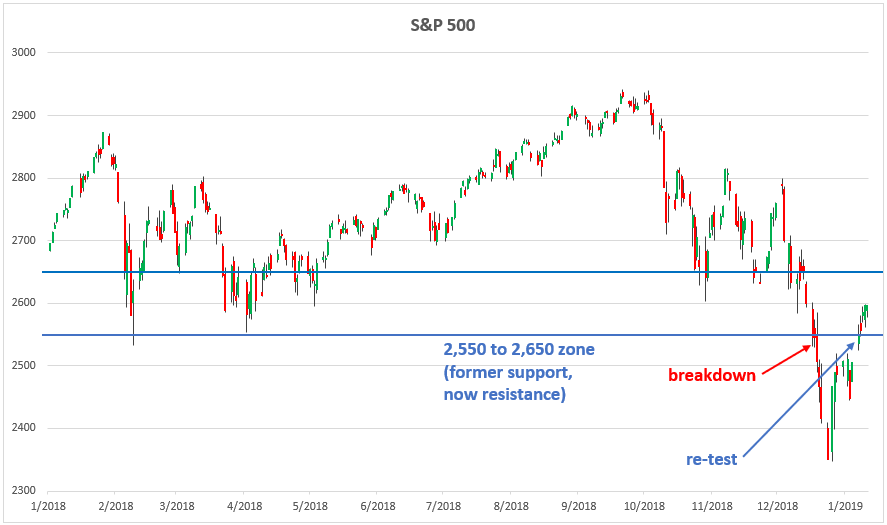
Throughout the market sell-off of the past few months, I’ve been showing key technical levels to help determine if further downside was likely or if the rout was truly over. In late-December, the S&P 500 broke below an important support zone from approximately 2,550 to 2,650 (which formed at the early-2018 lows), which represented a very important technical breakdown. The post-Christmas market bounce, so far, is simply a re-test of this zone, which is now a resistance. If the market bumps its head here, another wave down should be expected. If the market can close back above this zone in a decisive manner on the weekly chart, however, then it will have negated the December breakdown.
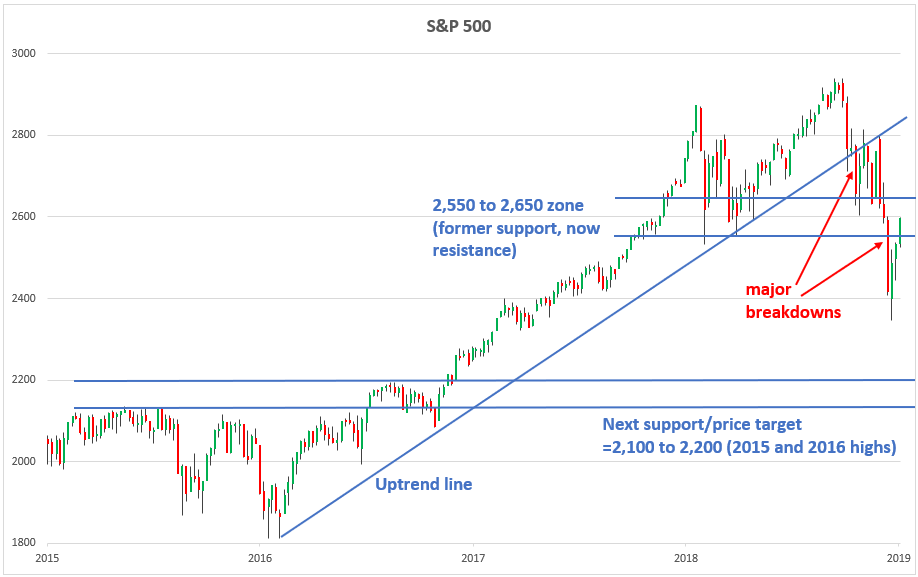
The weekly chart shows how two major technical breakdowns occurred in recent months. The current bounce has not resulted in a close back above the 2,550 to 2,650 resistance zone, so the S&P 500 is still in a downtrend.
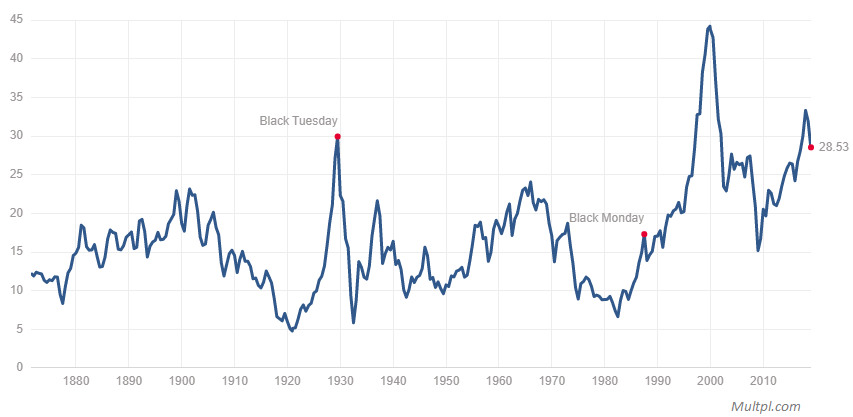
Why I am worried about further downside? Because the market is still quite overvalued, among other reasons (global debt is up by $75 trillion since 2008 – no big deal!). The chart below of the Shiller PE ratio (cyclically-adjusted PE ratio) shows that the U.S. stock market’s valuation is still in rarefied territory. It’s going to take much more than the decline since early-October to unwind this bubble.
For now, I am watching if the S&P 500 can close back above the 2,550 to 2,650 resistance zone on the weekly chart or if it bumps its head and embarks on another leg down.