Source: Clive Maund for Streetwise Reports
Technical analyst Clive Maund states that both COTs and the silver-to-gold ratio are at record extremes.
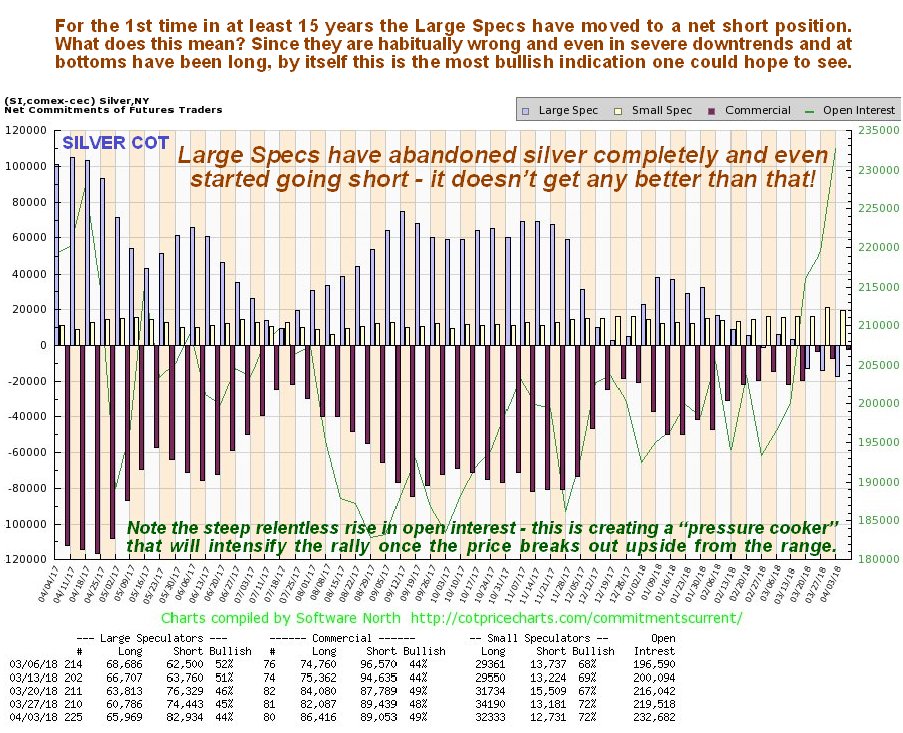
We now have the most bullish setup for silver that we have ever seen. After trading sideways/down for over 20 months now, investors have completely lost interest in it, which is, of course, the perfect breeding ground for a huge rally that seems to come out of nowhere. As we will proceed to see, both COTs and the silver to gold ratio are at record extremes that point to a major bull market in silver starting imminently.
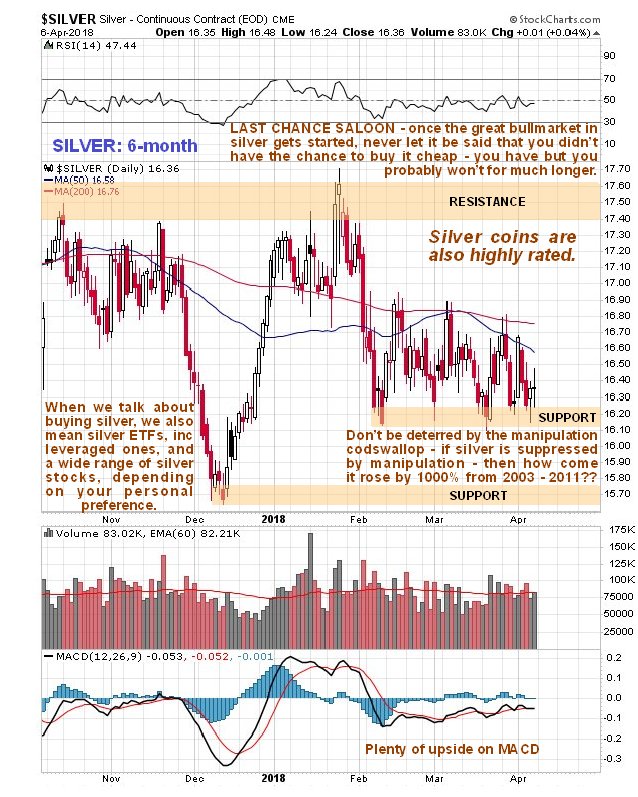
We will begin by looking at the latest price charts for silver. The 6-month chart looks dead boring, which is of course why those who are habitually wrong are making the dangerous mistake of shorting it. If you can stay awake for long enough looking at it, you will observe a dreary neutral trend and somewhat bearishly aligned moving averages—it certainly isn’t this chart that stirs our interest in silver.
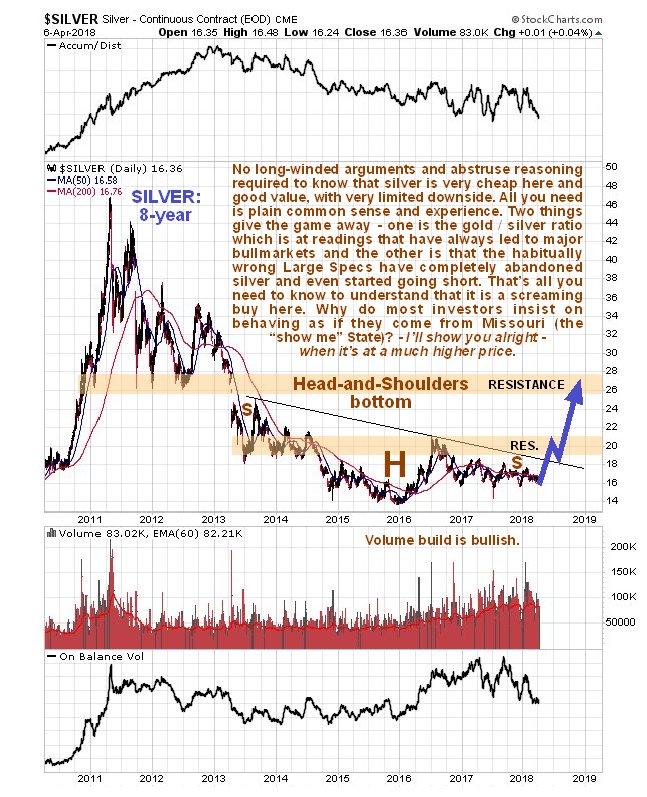
We also have record bullish extremes in the latest Hedgers chart. As we can see, high readings on this chart on the left side of it, when silver was in a bull market, led to major bull market advances, and even during the following bear market always led at least to a rally of sorts. Lest you make the mistake of thinking “Oh well, maybe it just means another bear market rally” don’t forget the completing Head-and-Shoulders bottom shown above and the fact that the Large Specs have given up and started to go short for the 1st time ever.
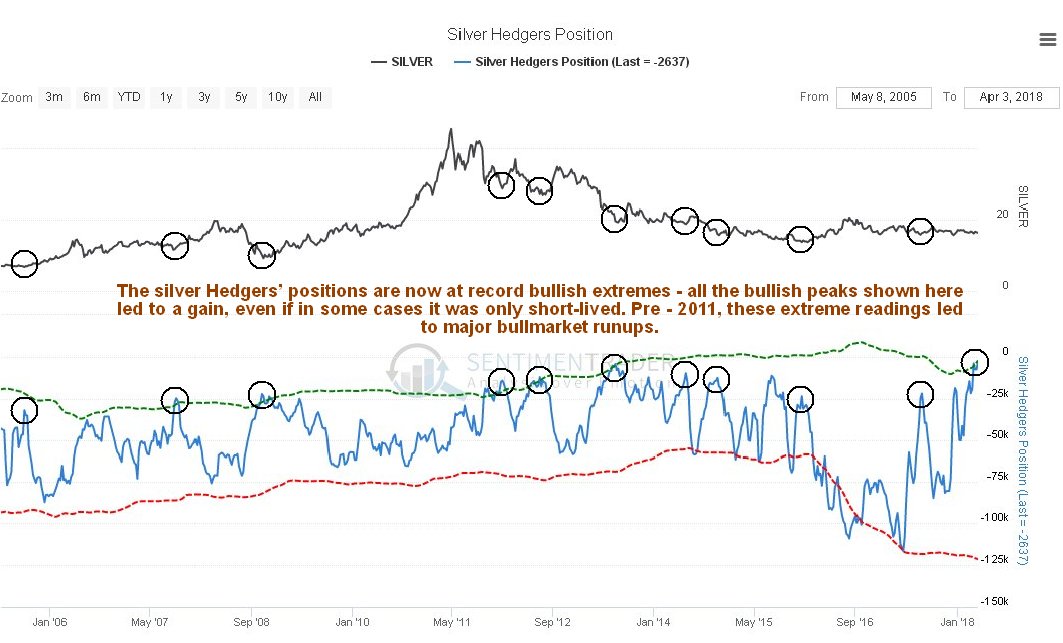
Chart courtesy of sentimentrader.com
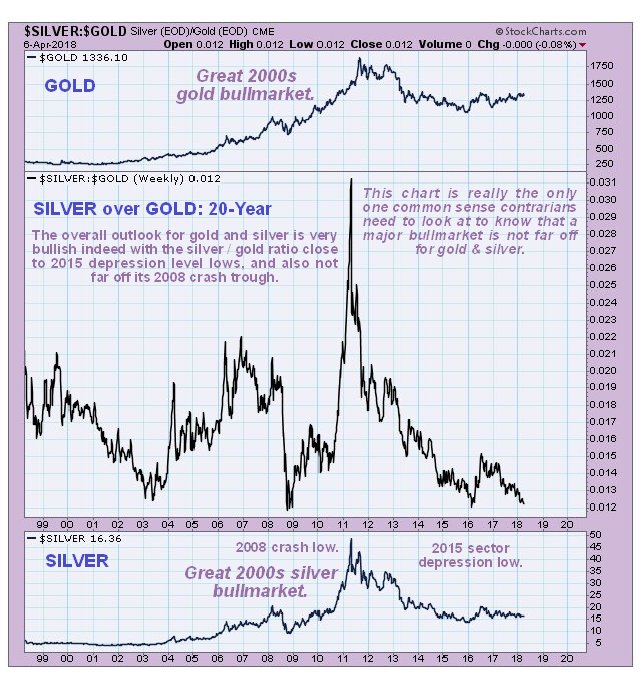
Finally, if all the above presented evidence isn’t enough to convince you that silver is drawing close to a new bull market, see what you make of our last chart, for the silver-gold ratio going back 20 years. As mentioned above, gold is favored more and more over silver as sector bear markets continue, because it is viewed as more solid and safer, so that silver gets cheaper and cheaper relative to gold, until an extreme is reached and the pendulum starts to swing back the other way with a new sector bull market. There were only three other occasions in the past 20 years that this ratio sank to the sort of levels it is at now—back in 2003 as the sector bull market was just getting started, then at the lows associated with the 2008 market crash, and finally in the depths of the PM sector depression at the end of 2015 and early 2016. After the first two occasions of these low readings, silver entered into a major uptrend that took it much higher, and on the 3rd occasion early in 2016 a significant rally followed, and now the ratio appears to be double bottoming with that low as gold and silver complete their base patterns. It is therefore logical to expect this setup to birth another major silver bull market, especially given the additional supportive factors that we looked at above.
Clive Maund has been president of http://www.clivemaund.com, a successful resource sector website, since its inception in 2003. He has 30 years’ experience in technical analysis and has worked for banks, commodity brokers and stockbrokers in the City of London. He holds a Diploma in Technical Analysis from the UK Society of Technical Analysts.