Government bond yields recently held above an important level, but the next test may prove dangerous for the stock market.
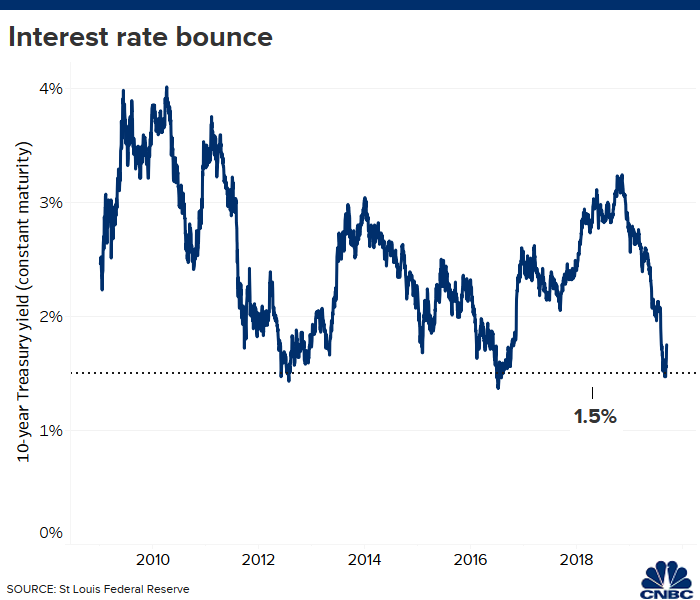
The benchmark 10-year Treasury note yield tested 1.5% in late August and early September, bouncing off that level and most recently trading around 1.8%.
That’s the third time the barrier has been broken since the economic recovery began in mid-2009, with the yield bouncing up strong each time. This signaled the renewal of the longest bull market run in Wall Street history that has coincided with the most durable expansion in U.S. history.
However, another challenge could mean tough times on the horizon, according to an analysis by Michael Hartnett, chief investment strategist at Bank of America Merrill Lynch. In his weekly analysis of market flows, Hartnett called the 10-year’s movements over the past decade, and specifically its ability to stay above the 1.5% yield level, “the most important chart in the world.”

https://www.cnbc.com/2019/09/13/the-most-important-chart-in-the-world-offers-a-warning-sign.html